## Chart Type: Density Plot of Learned Trust
### Overview
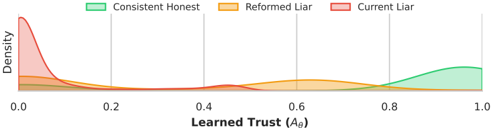
The image is a density plot showing the distribution of "Learned Trust" (Aθ) for three categories: "Consistent Honest," "Reformed Liar," and "Current Liar." The x-axis represents Learned Trust, ranging from 0.0 to 1.0. The y-axis represents Density. The plot illustrates how trust is distributed across these three groups.
### Components/Axes
* **X-axis:** Learned Trust (Aθ), ranging from 0.0 to 1.0, with markers at 0.0, 0.2, 0.4, 0.6, 0.8, and 1.0.
* **Y-axis:** Density.
* **Legend (Top-Left):**
* Green: Consistent Honest
* Orange: Reformed Liar
* Red: Current Liar
### Detailed Analysis
* **Consistent Honest (Green):** The density plot for "Consistent Honest" is concentrated towards the higher end of the Learned Trust scale. The distribution peaks around 0.95, indicating that individuals in this category are generally trusted more.
* **Reformed Liar (Orange):** The density plot for "Reformed Liar" shows a broader distribution. There is a small peak near 0.0, a small peak near 0.4, and a larger peak around 0.6. This suggests that trust in reformed liars is more variable, with some being trusted relatively little and others being trusted moderately.
* **Current Liar (Red):** The density plot for "Current Liar" is heavily concentrated towards the lower end of the Learned Trust scale. The distribution peaks near 0.0, indicating that individuals in this category are generally not trusted.
### Key Observations
* "Consistent Honest" individuals are generally trusted the most, with their trust distribution skewed towards higher values.
* "Current Liar" individuals are generally trusted the least, with their trust distribution skewed towards lower values.
* "Reformed Liar" individuals have a more complex trust distribution, with some being trusted more than current liars but less than consistently honest individuals.
### Interpretation
The density plot visually represents how learned trust varies across different types of individuals (consistent honest, reformed liar, and current liar). The data suggests that past behavior significantly influences trust. Consistently honest behavior leads to high trust, while current lying leads to low trust. Reformed liars occupy a middle ground, with their trust levels being more variable, possibly depending on the perceived sincerity and duration of their reformed behavior. The plot highlights the importance of consistent honesty in building and maintaining trust. The bimodal distribution of the "Reformed Liar" category suggests that there may be two distinct groups within this category: those who have successfully rebuilt trust and those who have not.