## Density Plot: Learned Trust Distribution by Behavioral Category
### Overview
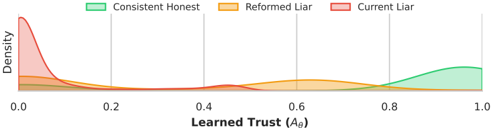
This image is a density plot visualizing the distribution of a metric called "Learned Trust (A_θ)" across three distinct behavioral categories. The plot compares how trust scores are distributed for "Consistent Honest," "Reformed Liar," and "Current Liar" agents or subjects.
### Components/Axes
* **Chart Type:** Density Plot (Kernel Density Estimation).
* **X-Axis:**
* **Title:** `Learned Trust (A_θ)`
* **Scale:** Linear, ranging from 0.0 to 1.0.
* **Markers:** Major ticks at 0.0, 0.2, 0.4, 0.6, 0.8, and 1.0.
* **Y-Axis:**
* **Title:** `Density`
* **Scale:** Linear (specific numerical values are not labeled).
* **Legend:**
* **Placement:** Top-center of the chart area.
* **Items:**
1. **Green Box:** `Consistent Honest`
2. **Orange Box:** `Reformed Liar`
3. **Red Box:** `Current Liar`
### Detailed Analysis
The plot displays three distinct probability density curves, each corresponding to a category in the legend.
1. **Consistent Honest (Green Line):**
* **Trend:** The density is very low from 0.0 to approximately 0.7, then rises sharply to form a single, prominent peak near the high end of the trust scale.
* **Key Points:** The distribution is heavily right-skewed. The peak density occurs at approximately `A_θ ≈ 0.95`. The curve approaches zero density as it nears 1.0.
2. **Reformed Liar (Orange Line):**
* **Trend:** This distribution is bimodal (has two peaks). It shows a small, broad peak at the low end of the trust scale and a larger, more defined peak at the high end.
* **Key Points:**
* First (lower) peak: Centered around `A_θ ≈ 0.05`.
* Second (higher) peak: Centered around `A_θ ≈ 0.75`.
* The density is relatively low and flat between the two peaks (from ~0.2 to ~0.6).
3. **Current Liar (Red Line):**
* **Trend:** The density is extremely high at the very low end of the trust scale and drops off rapidly as trust increases.
* **Key Points:** The distribution is heavily left-skewed. The peak density occurs at or very near `A_θ ≈ 0.0`. The curve falls to near-zero density by `A_θ ≈ 0.2` and remains negligible across the rest of the scale.
### Key Observations
* **Clear Separation:** The three distributions are largely distinct, with minimal overlap. "Current Liar" occupies the low-trust region (0.0-0.2), "Consistent Honest" occupies the high-trust region (0.8-1.0), and "Reformed Liar" spans both regions with a gap in the middle.
* **Bimodality of Reformed Liar:** The "Reformed Liar" category is the only one with a bimodal distribution, suggesting it may contain two sub-populations: one that is still perceived as untrustworthy and another that has successfully rebuilt trust.
* **Density vs. Probability:** The y-axis represents density, not direct probability. The area under each curve integrates to 1. The height indicates the relative concentration of data points at a given trust value.
### Interpretation
This density plot provides a visual summary of how a trust metric (`A_θ`) discriminates between different behavioral histories.
* **What the data suggests:** The learned trust model appears to effectively assign low scores to active liars and high scores to consistently honest agents. The interesting finding is the profile of the "Reformed Liar," which suggests the model captures a transitional or split state. Some reformed liars are still distrusted (low-trust peak), while others have successfully convinced the model of their honesty (high-trust peak).
* **How elements relate:** The x-axis (`A_θ`) is the output of a learning process. The separation of the curves indicates this output is strongly correlated with the ground-truth behavioral labels (Honest, Liar, Reformed). The legend defines the ground-truth classes against which the model's output is being evaluated.
* **Notable patterns/anomalies:** The most notable pattern is the stark bimodality for "Reformed Liar." This could indicate that "reformation" is not a uniform process; agents either successfully transition to the high-trust cluster or fail and remain in the low-trust cluster, with few occupying the middle ground (`A_θ` 0.3-0.6). The almost complete absence of "Consistent Honest" agents with low trust scores and "Current Liars" with high trust scores suggests the model has high accuracy for these clear-cut cases.