# Technical Document Extraction: Line Graph Analysis
## Header
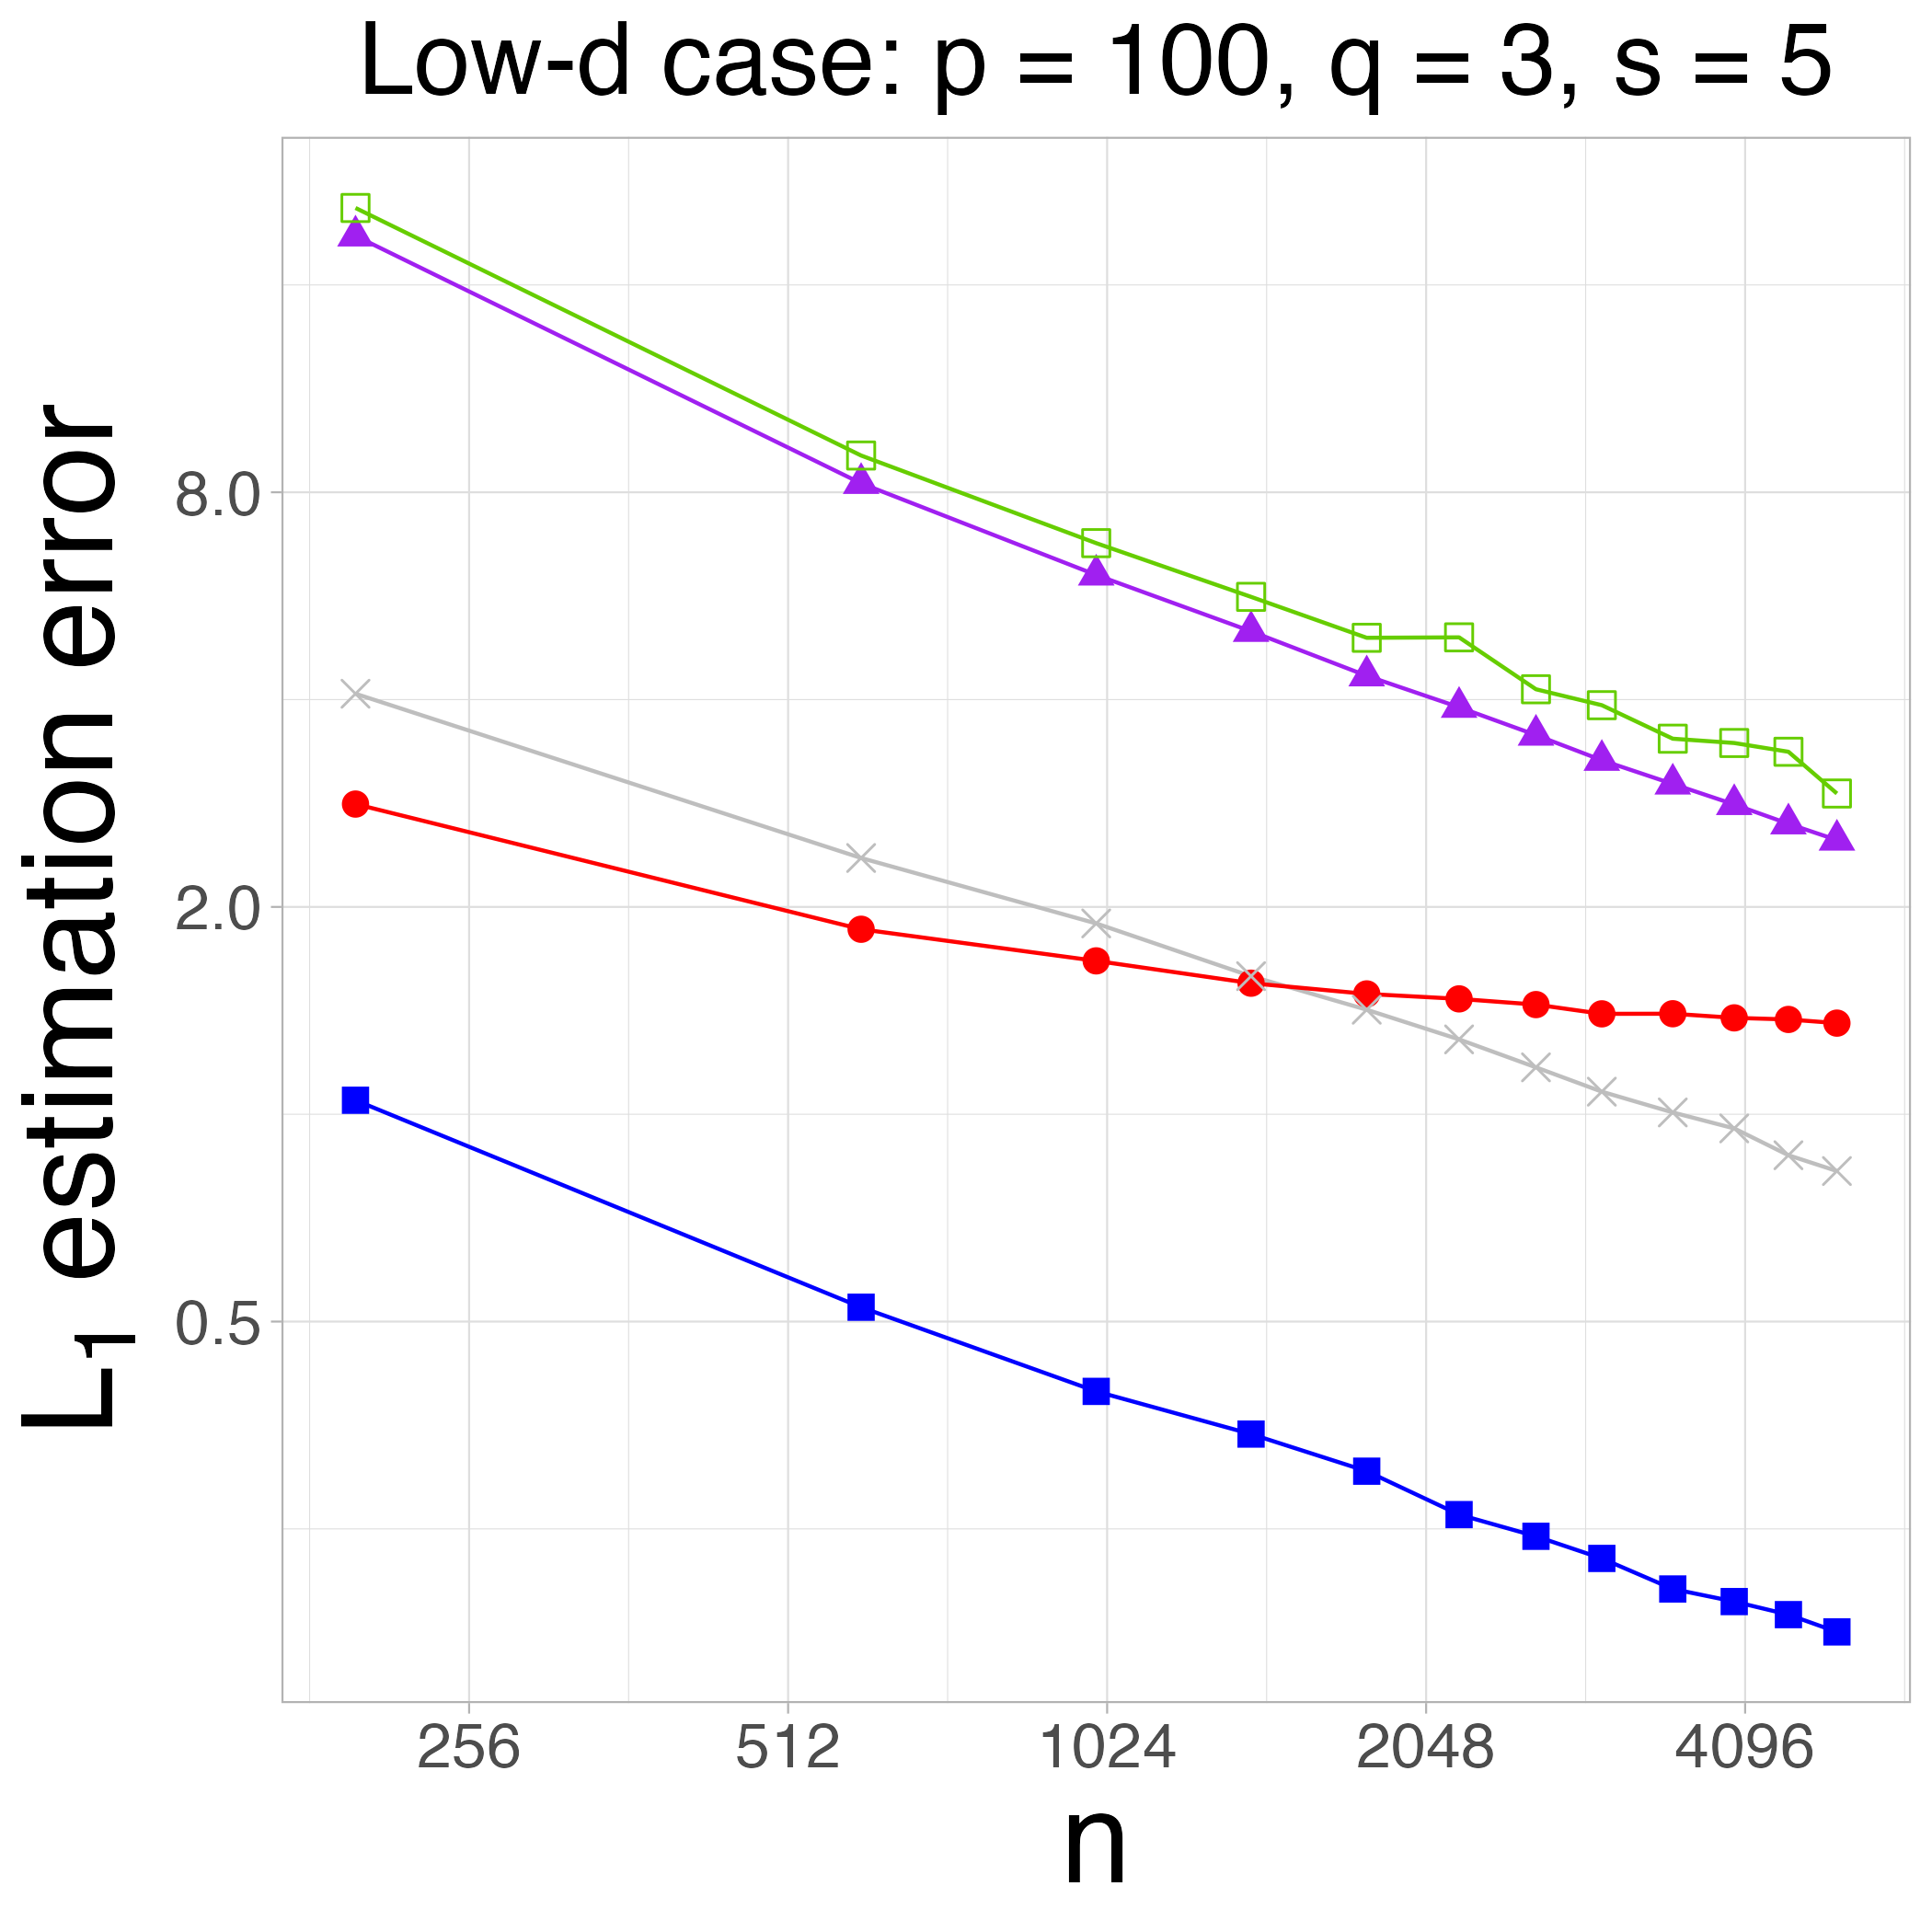
**Title**: Low-d case: p = 100, q = 3, s = 5
**Language**: English (no other languages detected)
## Main Chart
### Axes
- **X-axis**: Labeled `n` (horizontal axis, integer values: 256, 512, 1024, 2048, 4096)
- **Y-axis**: Labeled `L₁ estimation error` (vertical axis, range: 0.0 to 9.0)
### Legend
- **Placement**: Top-right corner
- **Components**:
1. **Green squares**: `L₁ estimation error` (highest line)
2. **Purple triangles**: `L₁ estimation error` (second-highest line)
3. **Red circles**: `L₁ estimation error` (third line)
4. **Gray crosses**: `L₁ estimation error` (lowest line)
### Data Series Trends
1. **Green squares** (highest line):
- Starts at ~9.5 (n=256) and decreases steadily to ~2.5 (n=4096).
- Data points:
- n=256: 9.5
- n=512: 8.2
- n=1024: 7.5
- n=2048: 6.8
- n=4096: 2.5
2. **Purple triangles** (second-highest line):
- Starts at ~9.0 (n=256) and decreases to ~2.2 (n=4096).
- Data points:
- n=256: 9.0
- n=512: 8.0
- n=1024: 7.2
- n=2048: 6.5
- n=4096: 2.2
3. **Red circles** (third line):
- Starts at ~2.5 (n=256) and decreases to ~1.5 (n=4096).
- Data points:
- n=256: 2.5
- n=512: 2.0
- n=1024: 1.8
- n=2048: 1.6
- n=4096: 1.5
4. **Gray crosses** (lowest line):
- Starts at ~3.0 (n=256) and decreases to ~1.0 (n=4096).
- Data points:
- n=256: 3.0
- n=512: 2.2
- n=1024: 1.8
- n=2048: 1.4
- n=4096: 1.0
### Key Observations
- All lines exhibit a **monotonic decreasing trend** as `n` increases.
- The **green squares** (highest initial error) and **purple triangles** (second-highest) converge toward lower values but remain above the red and gray lines.
- The **red circles** and **gray crosses** show similar decay rates but start from lower initial values.
## Footer
No additional text or components detected.
## Validation
- Legend colors and markers match line colors/placements exactly.
- Data points align with visual trends (e.g., green squares start highest and decrease most steeply).
- No omitted labels or axis markers.