## Scatter Plot: Music Genre and Language Distribution
### Overview
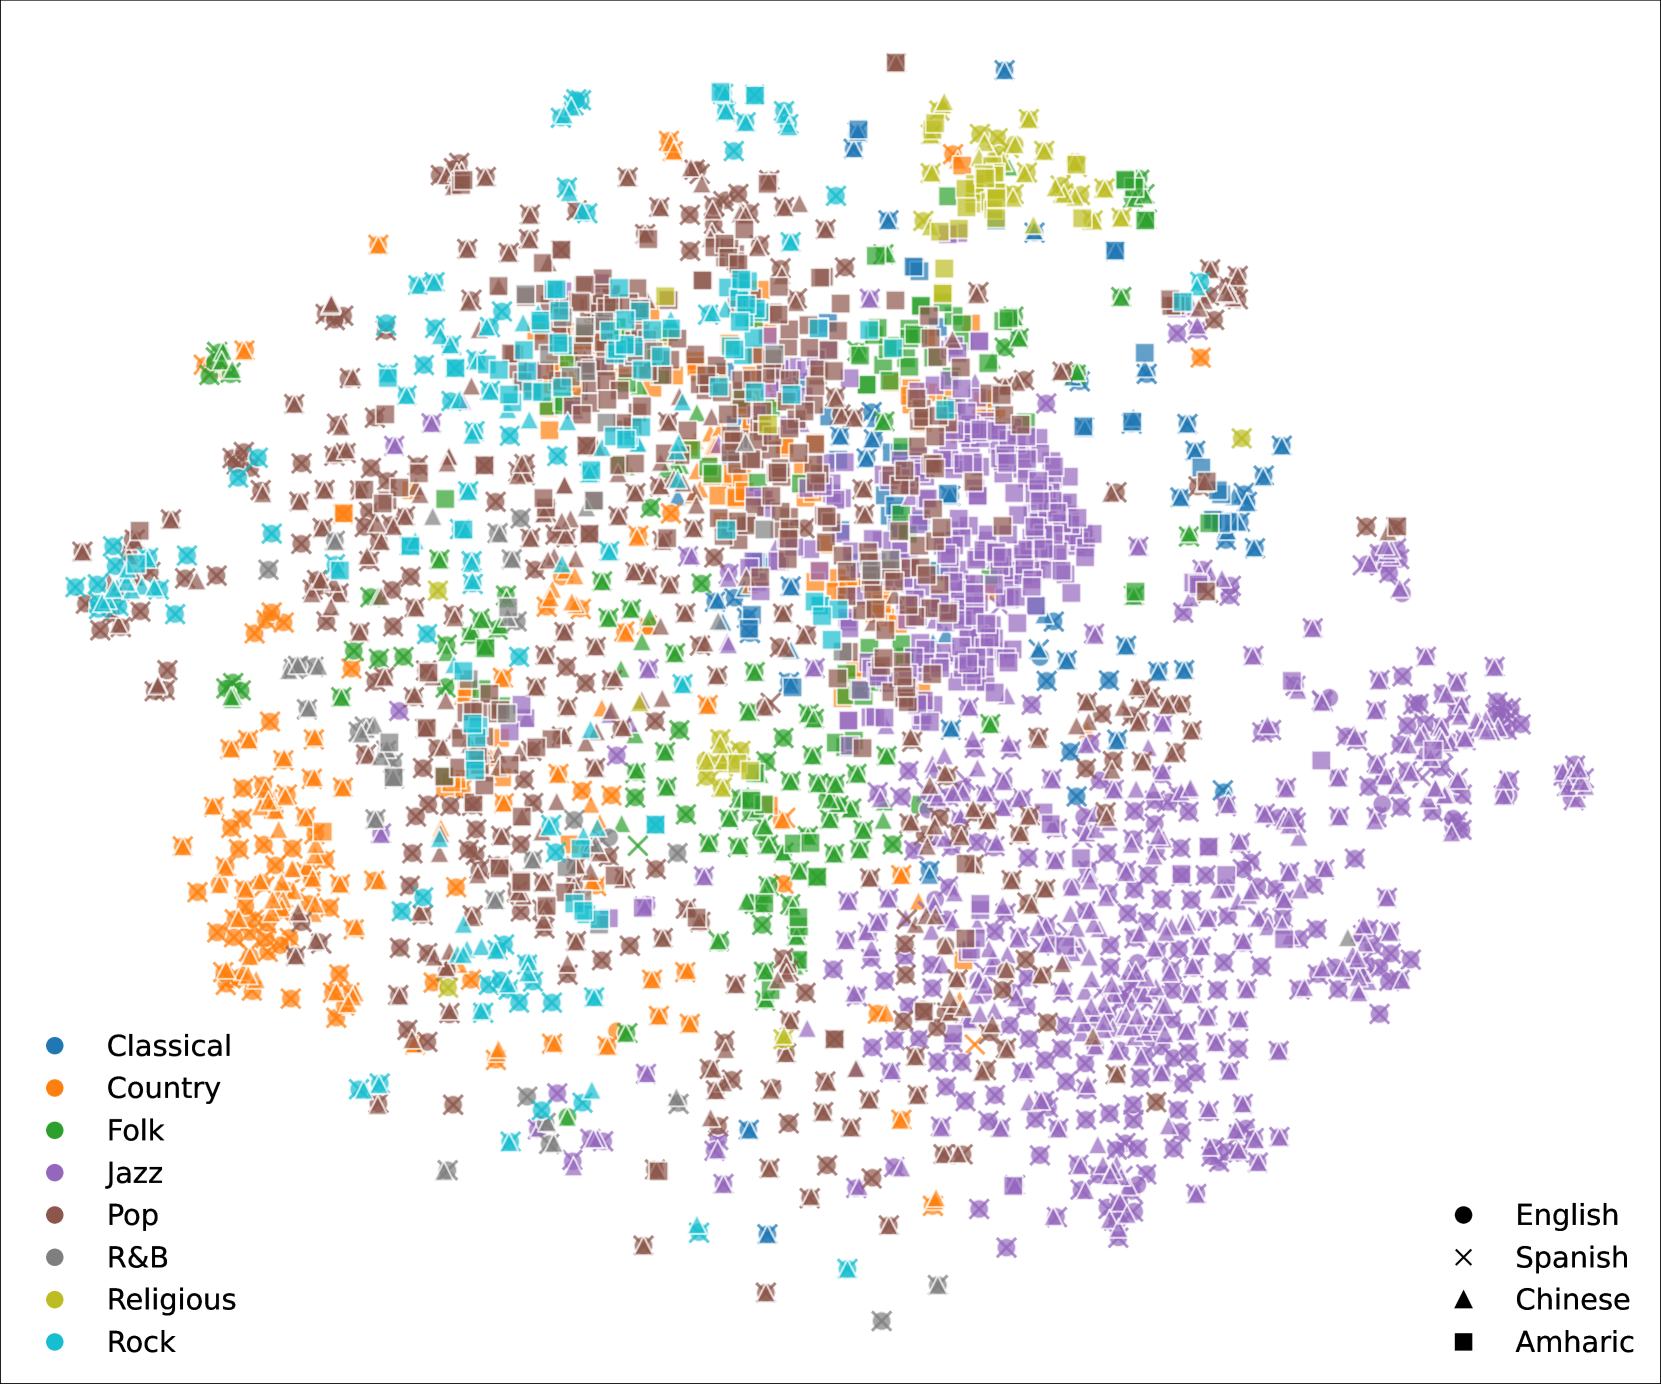
The image is a scatter plot visualizing the distribution of music genres and languages across a two-dimensional space. Data points are represented by colored and shaped markers, with a legend on the left for genres and a secondary legend on the right for languages. The plot reveals clusters and spatial patterns, suggesting relationships between genres, languages, and their distributions.
---
### Components/Axes
- **X/Y Axes**: No explicit labels or scales are visible, but the axes define a coordinate system for positioning data points.
- **Legend (Left)**:
- **Genres**:
- Classical: Blue circles
- Country: Orange crosses
- Folk: Green triangles
- Jazz: Purple squares
- Pop: Brown diamonds
- R&B: Gray pentagons
- Religious: Yellow hexagons
- Rock: Cyan stars
- **Legend (Right)**:
- **Languages**:
- English: Black circles
- Spanish: Red crosses
- Chinese: Blue triangles
- Amharic: Purple squares
---
### Detailed Analysis
1. **Genre Distribution**:
- **Jazz (Purple Squares)**: Dominates the center-right region, forming the largest cluster (~30% of points). High density suggests prevalence.
- **Country (Orange Crosses)**: Concentrated in the bottom-left quadrant (~15% of points).
- **Folk (Green Triangles)**: Clustered in the top-left (~10% of points).
- **Classical (Blue Circles)**: Scattered across the top-right (~8% of points).
- **Pop (Brown Diamonds)**: Spread across the center (~12% of points).
- **R&B (Gray Pentagons)**: Concentrated in the bottom-center (~7% of points).
- **Religious (Yellow Hexagons)**: Small cluster in the top-right (~5% of points).
- **Rock (Cyan Stars)**: Scattered in the bottom-right (~6% of points).
2. **Language Distribution**:
- **English (Black Circles)**: Widely dispersed, with no dominant cluster.
- **Spanish (Red Crosses)**: Clustered near the center (~10% of points).
- **Chinese (Blue Triangles)**: Concentrated in the top-right (~8% of points).
- **Amharic (Purple Squares)**: Overlaps with Jazz (purple squares) in the center-right (~5% of points).
3. **Color/Shape Consistency**:
- Confirmed: Genre colors/shapes match the legend (e.g., Jazz = purple squares).
- **Conflict**: Amharic (purple squares) shares the same color/shape as Jazz, potentially causing ambiguity. This may indicate a data labeling error or intentional overlap for thematic emphasis.
---
### Key Observations
- **Dominant Genres**: Jazz and Country occupy the largest spatial regions.
- **Language Overlap**: Spanish and Amharic clusters intersect with genre clusters (e.g., Amharic overlaps with Jazz).
- **Scattered Genres**: Classical and Rock show the most dispersed distributions.
- **Central Density**: The center of the plot contains the highest concentration of data points, suggesting a mix of genres/languages in this region.
---
### Interpretation
The plot highlights how music genres and languages are spatially distributed, potentially reflecting cultural or regional associations. For example:
- **Jazz and Amharic Overlap**: The shared purple squares in the center-right may imply a thematic or cultural link, though this could also be a visualization artifact.
- **Classical and Rock Dispersion**: Their scattered nature might indicate broader, less localized popularity.
- **Central Clusters**: The high density of Spanish and Amharic points in the center suggests these languages are associated with a mix of genres, possibly reflecting multilingual or hybrid musical traditions.
**Notable Anomalies**:
- The overlap between Amharic and Jazz (same color/shape) risks misinterpretation. This could be a critical flaw in the data encoding or an intentional design choice to emphasize a connection.
- The lack of axis labels limits quantitative analysis, relying instead on relative spatial positioning.
This visualization underscores the interplay between artistic expression (genres) and linguistic diversity, offering insights into how these elements coexist or diverge in the dataset.