## Line Graph: Average Correct Flips Across Iterations
### Overview
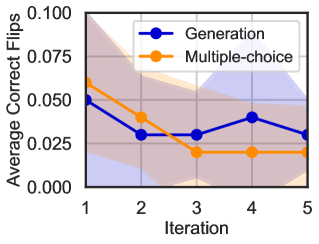
The image depicts a line graph comparing two methods ("Generation" and "Multiple-choice") across five iterations. The y-axis represents "Average Correct Flips" (ranging from 0.000 to 0.100), while the x-axis represents "Iteration" (1 to 5). Shaded regions around each line indicate variability or confidence intervals. The legend is positioned in the top-right corner.
### Components/Axes
- **X-axis (Iteration)**: Labeled "Iteration," with discrete values 1, 2, 3, 4, 5.
- **Y-axis (Average Correct Flips)**: Labeled "Average Correct Flips," scaled from 0.000 to 0.100 in increments of 0.025.
- **Legend**: Located in the top-right corner, with:
- **Blue line**: "Generation"
- **Orange line**: "Multiple-choice"
- **Shaded Regions**: Gray areas surrounding each line, representing variability or uncertainty.
### Detailed Analysis
#### Generation (Blue Line)
- **Trend**: Starts at ~0.050 (Iteration 1), drops to ~0.025 (Iteration 2), remains stable at ~0.025 (Iteration 3), rises to ~0.035 (Iteration 4), then slightly declines to ~0.025 (Iteration 5).
- **Variability**: Shaded region widest at Iteration 4 (~0.015–0.055 range), narrowing to ~0.010–0.040 at Iteration 5.
#### Multiple-choice (Orange Line)
- **Trend**: Starts at ~0.060 (Iteration 1), decreases to ~0.030 (Iteration 2), stabilizes at ~0.020 (Iterations 3–5).
- **Variability**: Shaded region narrowest (~0.010–0.030 at Iteration 2), widening slightly to ~0.005–0.035 by Iteration 5.
### Key Observations
1. **Stability**: The "Multiple-choice" method shows a steeper initial decline and stabilizes earlier (Iteration 3 onward), while "Generation" fluctuates more.
2. **Variability**: The "Generation" method exhibits significantly wider confidence intervals, especially at Iteration 4.
3. **Performance**: Both methods improve slightly over iterations, but "Multiple-choice" maintains a higher baseline after Iteration 2.
### Interpretation
The data suggests that the "Multiple-choice" method is more consistent and reliable, as evidenced by its narrower confidence intervals and stable performance after Iteration 2. In contrast, the "Generation" method shows higher variability, with a notable spike in uncertainty at Iteration 4. The shaded regions likely represent 95% confidence intervals, indicating that the "Generation" method’s estimates are less precise. The trends imply that while both methods improve with iterations, "Multiple-choice" may be preferable in scenarios prioritizing stability over incremental gains.