## Chart: Average Correct Flips vs. Iteration
### Overview
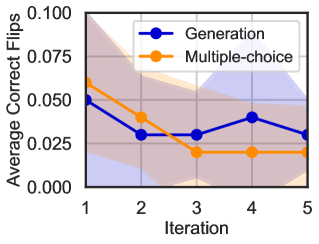
The image is a line chart comparing the average correct flips for two methods, "Generation" and "Multiple-choice," across five iterations. The chart displays the mean values as points connected by lines, with shaded regions indicating the variability or confidence intervals around each mean.
### Components/Axes
* **Y-axis (Vertical):** "Average Correct Flips," ranging from 0.000 to 0.100.
* **X-axis (Horizontal):** "Iteration," ranging from 1 to 5.
* **Legend (Top-Right):**
* Blue line with circle markers: "Generation"
* Orange line with circle markers: "Multiple-choice"
### Detailed Analysis
* **Generation (Blue):**
* Trend: Decreases from iteration 1 to 3, then increases slightly at iteration 4, and decreases again at iteration 5.
* Data Points:
* Iteration 1: Approximately 0.050
* Iteration 2: Approximately 0.030
* Iteration 3: Approximately 0.030
* Iteration 4: Approximately 0.040
* Iteration 5: Approximately 0.030
* **Multiple-choice (Orange):**
* Trend: Decreases from iteration 1 to 3, then remains relatively constant from iteration 3 to 5.
* Data Points:
* Iteration 1: Approximately 0.065
* Iteration 2: Approximately 0.040
* Iteration 3: Approximately 0.020
* Iteration 4: Approximately 0.020
* Iteration 5: Approximately 0.020
### Key Observations
* The "Multiple-choice" method starts with a higher average correct flips than the "Generation" method.
* Both methods show a decrease in average correct flips from iteration 1 to iteration 3.
* The "Generation" method shows a slight increase at iteration 4 before decreasing again at iteration 5.
* The "Multiple-choice" method stabilizes after iteration 3, showing little change in average correct flips.
### Interpretation
The chart suggests that both methods initially struggle to maintain a high average of correct flips as iterations progress. The "Multiple-choice" method starts stronger but plateaus, while the "Generation" method shows a slight recovery at iteration 4 before declining again. The shaded regions indicate the variability in the data, which could be due to factors such as the complexity of the task or the learning rate of the models. The stabilization of the "Multiple-choice" method after iteration 3 could indicate that it has reached a performance limit, while the "Generation" method's fluctuation suggests it may have the potential for further improvement with more iterations or different training strategies.