\n
## Line Chart: Average Correct Flips vs. Iteration
### Overview
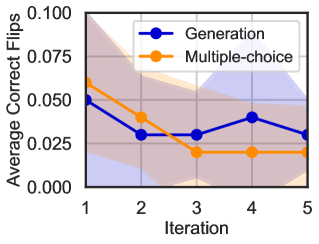
This image presents a line chart illustrating the relationship between the iteration number and the average number of correct flips for two different methods: "Generation" and "Multiple-choice". The chart uses lines with markers to represent the data, and shaded areas to indicate the variance or confidence interval around each line.
### Components/Axes
* **X-axis:** Labeled "Iteration", with markers at 1, 2, 3, 4, and 5.
* **Y-axis:** Labeled "Average Correct Flips", with a scale ranging from 0.000 to 0.100, incrementing by 0.025.
* **Legend:** Located in the top-right corner, containing two entries:
* "Generation" - represented by a dark blue line with circular markers.
* "Multiple-choice" - represented by an orange line with circular markers.
* **Shaded Areas:** A light blue shaded area surrounds the "Generation" line, and a pale orange shaded area surrounds the "Multiple-choice" line. These likely represent standard deviation or confidence intervals.
### Detailed Analysis
**Generation (Dark Blue Line):**
The line representing "Generation" initially slopes downward from Iteration 1 to Iteration 2, then exhibits a slight upward trend from Iteration 2 to Iteration 4, before decreasing again at Iteration 5.
* Iteration 1: Approximately 0.045
* Iteration 2: Approximately 0.030
* Iteration 3: Approximately 0.032
* Iteration 4: Approximately 0.038
* Iteration 5: Approximately 0.030
**Multiple-choice (Orange Line):**
The line representing "Multiple-choice" consistently slopes downward from Iteration 1 to Iteration 5.
* Iteration 1: Approximately 0.065
* Iteration 2: Approximately 0.045
* Iteration 3: Approximately 0.020
* Iteration 4: Approximately 0.022
* Iteration 5: Approximately 0.018
The shaded areas around each line indicate the variability of the data. The "Generation" shaded area is wider at Iteration 2 and 3, suggesting greater variance in those iterations. The "Multiple-choice" shaded area appears relatively consistent across all iterations.
### Key Observations
* The "Multiple-choice" method starts with a higher average correct flips than the "Generation" method.
* The "Multiple-choice" method shows a consistent decrease in average correct flips with each iteration.
* The "Generation" method exhibits more fluctuation in average correct flips across iterations, with a slight increase at Iteration 4.
* By Iteration 5, the "Generation" method's average correct flips is approaching that of the "Multiple-choice" method.
### Interpretation
The chart suggests that while the "Multiple-choice" method initially performs better, its effectiveness diminishes rapidly with each iteration. The "Generation" method, although starting with a lower performance, shows some resilience and even a temporary improvement at Iteration 4. This could indicate that the "Generation" method benefits from continued iterations, potentially learning or adapting over time, while the "Multiple-choice" method reaches a point of diminishing returns. The wider shaded area around the "Generation" line suggests that the results for this method are more sensitive to variations or random factors. The overall trend suggests a trade-off between initial performance and long-term adaptability between the two methods. The data implies that for a longer series of iterations, the "Generation" method may eventually outperform the "Multiple-choice" method.