\n
## Line Chart: Average Correct Flips Over Iterations
### Overview
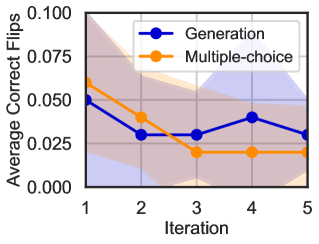
The image is a line chart comparing the performance of two methods, "Generation" and "Multiple-choice," across five iterations. The performance metric is "Average Correct Flips." The chart includes shaded regions around each line, likely representing confidence intervals or standard deviation, indicating the variability of the data.
### Components/Axes
* **Chart Type:** Line chart with two data series and shaded error bands.
* **Y-Axis:**
* **Label:** "Average Correct Flips"
* **Scale:** Linear, ranging from 0.000 to 0.100.
* **Major Ticks:** 0.000, 0.025, 0.050, 0.075, 0.100.
* **X-Axis:**
* **Label:** "Iteration"
* **Scale:** Discrete, with integer values from 1 to 5.
* **Legend:**
* **Position:** Top-right corner of the plot area.
* **Series 1:** "Generation" - Represented by a blue line with circular markers.
* **Series 2:** "Multiple-choice" - Represented by an orange line with circular markers.
* **Data Series & Shading:**
* The "Generation" (blue) line is surrounded by a light blue shaded area.
* The "Multiple-choice" (orange) line is surrounded by a light orange shaded area.
### Detailed Analysis
**Trend Verification & Data Points (Approximate):**
1. **Series: Generation (Blue Line)**
* **Visual Trend:** The line shows a fluctuating trend. It starts at a moderate level, dips, recovers slightly, and ends lower than its starting point. The shaded blue area is notably wide, especially at iterations 1 and 5, indicating high variance.
* **Data Points:**
* Iteration 1: ~0.050
* Iteration 2: ~0.030
* Iteration 3: ~0.030
* Iteration 4: ~0.040
* Iteration 5: ~0.030
2. **Series: Multiple-choice (Orange Line)**
* **Visual Trend:** The line shows a clear downward trend that plateaus. It starts as the higher-performing method, declines steadily until iteration 3, and then remains flat. The shaded orange area is narrower than the blue one, suggesting more consistent results.
* **Data Points:**
* Iteration 1: ~0.060
* Iteration 2: ~0.040
* Iteration 3: ~0.020
* Iteration 4: ~0.020
* Iteration 5: ~0.020
### Key Observations
* **Performance Crossover:** The "Multiple-choice" method starts with a higher average correct flips score (~0.060) than "Generation" (~0.050) at Iteration 1.
* **Convergence and Divergence:** The two methods converge at Iteration 2 (~0.030 vs ~0.040). By Iteration 3, "Generation" (~0.030) surpasses "Multiple-choice" (~0.020) and maintains a higher average score for the remaining iterations.
* **Stability vs. Variance:** The "Multiple-choice" method shows a stable, low plateau from Iteration 3 onward. The "Generation" method exhibits more fluctuation and has a significantly wider confidence band, indicating less predictable performance.
* **Overall Decline:** Both methods show a net decrease in "Average Correct Flips" from Iteration 1 to Iteration 5.
### Interpretation
The data suggests a trade-off between initial performance and long-term stability between the two methods.
* The **"Multiple-choice"** approach appears to be more effective initially but suffers a rapid and consistent decline, stabilizing at a low performance level. Its narrow error band implies this decline is a reliable outcome of the method under the tested conditions.
* The **"Generation"** approach starts slightly worse but demonstrates more resilience. While its performance fluctuates and is more variable (wide error band), it does not collapse to the same low baseline as the multiple-choice method. By the later iterations, it consistently outperforms the multiple-choice approach.
This pattern could indicate that the "Generation" method, while noisier, is better at maintaining a certain level of capability over repeated iterations, whereas the "Multiple-choice" method may be prone to a form of rapid degradation or saturation. The investigation would benefit from understanding the specific task ("Correct Flips") to contextualize why performance generally trends downward for both methods.