## Diagram: XBM Process Flow
### Overview
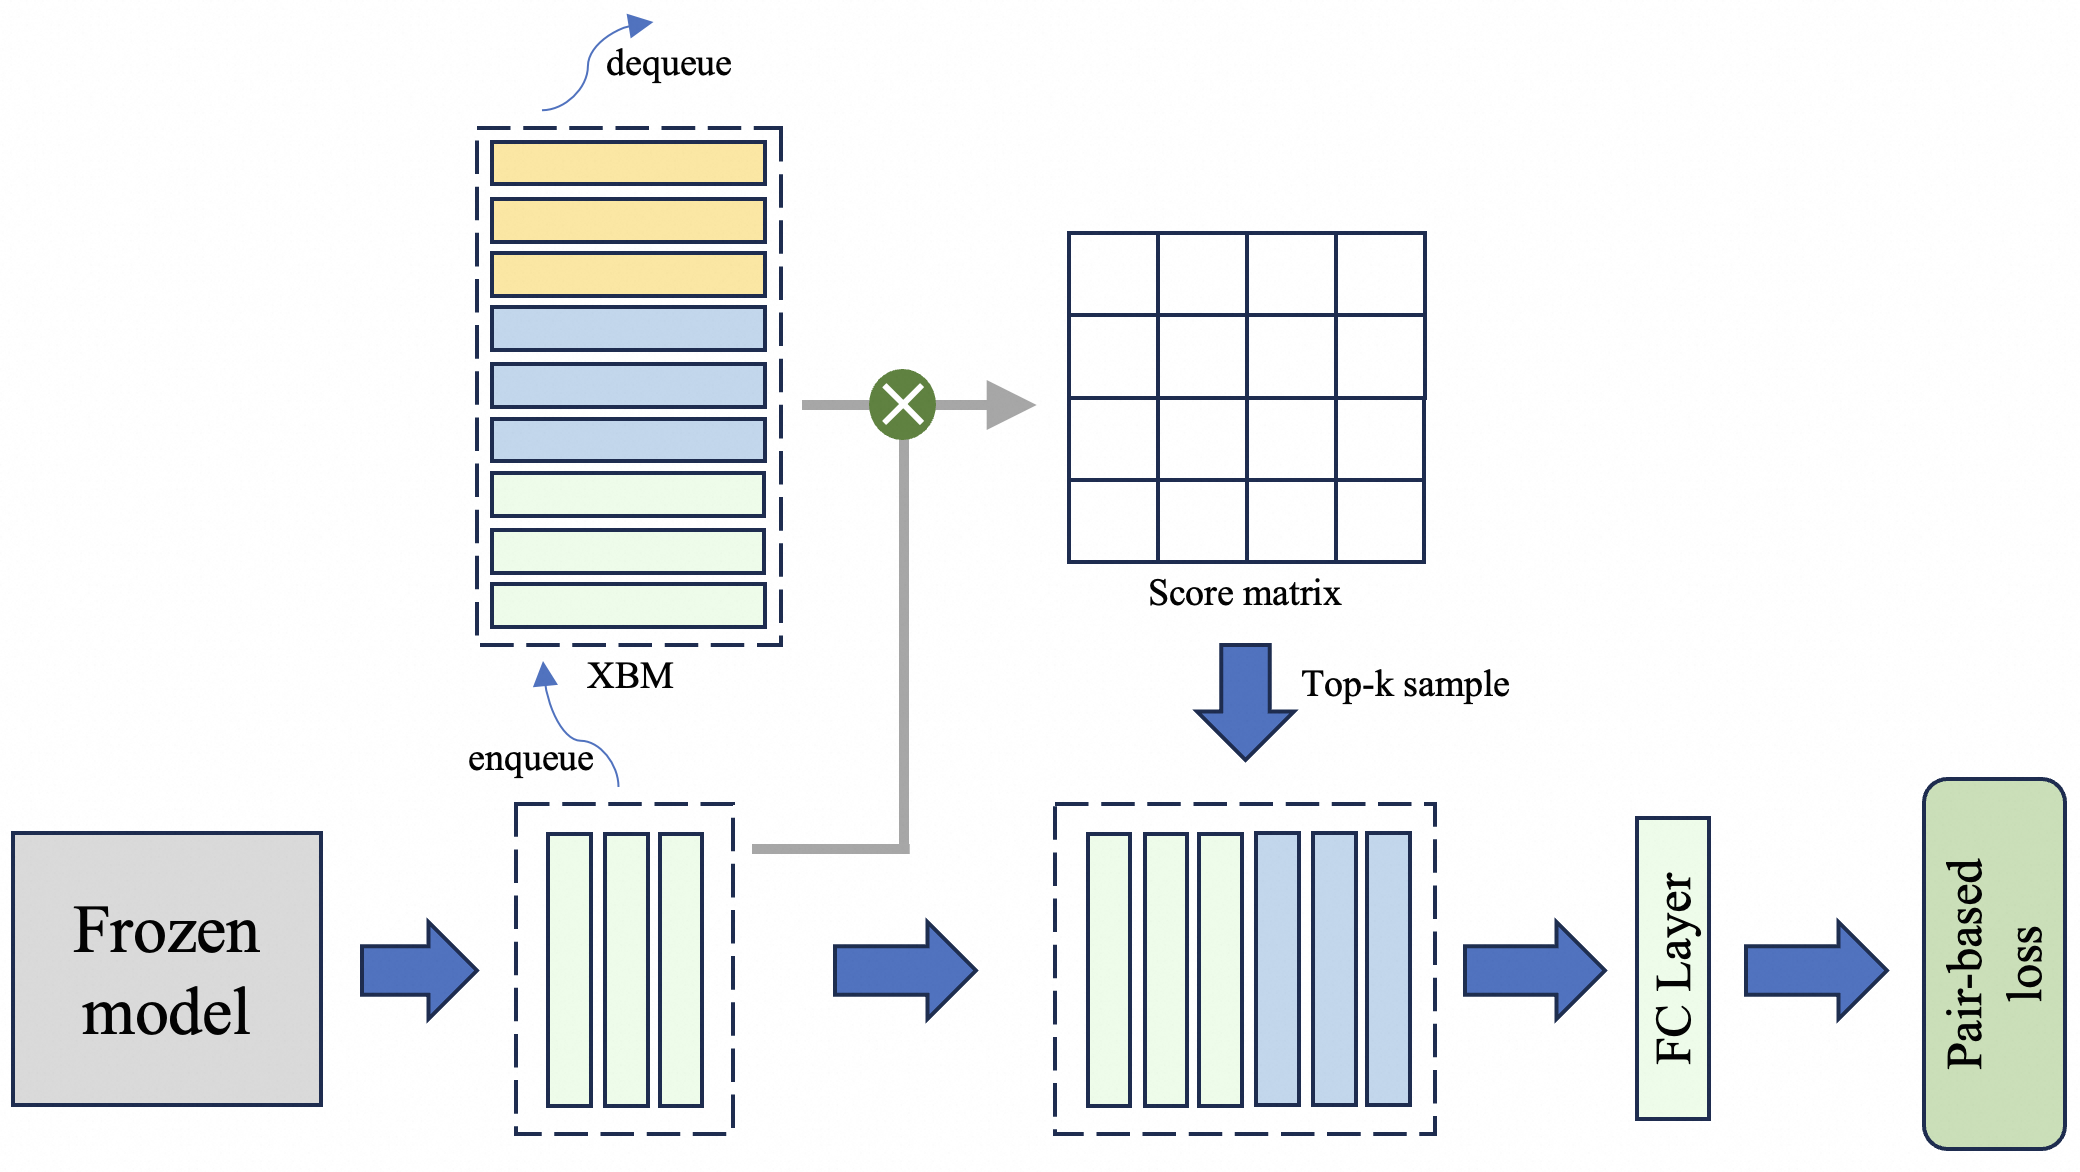
The image is a diagram illustrating a process flow involving a "Frozen model," an "XBM" (presumably a memory bank), a "Score matrix," a "Top-k sample" selection, an "FC Layer," and a "Pair-based loss" calculation. The diagram shows how data flows between these components.
### Components/Axes
* **Frozen model:** A gray rectangle on the left, representing a pre-trained model.
* **XBM:** Two dashed rectangles labeled "XBM". The top XBM contains 10 horizontal rectangles, with the top two colored yellow, the next four colored light blue, and the bottom four colored light green. The bottom XBM contains three vertical rectangles colored light green. Arrows indicate "enqueue" into the bottom XBM and "dequeue" from the top XBM.
* **Score matrix:** A 4x4 grid in the center of the diagram.
* **Top-k sample:** A dashed rectangle containing 6 vertical rectangles, with the left two colored light green and the right four colored light blue.
* **FC Layer:** A light green rectangle.
* **Pair-based loss:** A rounded light green rectangle on the right.
* **Arrows:** Blue arrows indicate the direction of data flow between components.
### Detailed Analysis or ### Content Details
1. **Frozen model:** The process starts with the "Frozen model."
2. **Enqueue:** The output of the "Frozen model" is enqueued into the bottom "XBM" which contains three light green vertical rectangles.
3. **XBM (Memory Bank):** The "XBM" is represented by two dashed rectangles. The bottom one shows the enqueue operation, and the top one shows the dequeue operation. The top XBM contains 10 horizontal rectangles, with the top two colored yellow, the next four colored light blue, and the bottom four colored light green.
4. **Score matrix:** The output from the top "XBM" is multiplied (indicated by a green circle with an "X" inside) with another input to generate a "Score matrix," which is a 4x4 grid.
5. **Top-k sample:** A "Top-k sample" is selected from the "Score matrix." The "Top-k sample" is represented by a dashed rectangle containing 6 vertical rectangles, with the left two colored light green and the right four colored light blue.
6. **FC Layer:** The "Top-k sample" is then passed through an "FC Layer."
7. **Pair-based loss:** Finally, a "Pair-based loss" is calculated.
### Key Observations
* The "XBM" acts as a memory bank, with enqueue and dequeue operations.
* The "Score matrix" is a 4x4 grid, suggesting a comparison or relationship between 4 different entities.
* The colors of the rectangles in the "XBM" and "Top-k sample" change from light green to light blue to yellow, possibly indicating different stages or levels of processing.
### Interpretation
The diagram illustrates a machine learning process where a "Frozen model" generates embeddings that are stored in a memory bank ("XBM"). These embeddings are then used to compute a "Score matrix," from which "Top-k samples" are selected. These samples are then passed through a fully connected layer ("FC Layer") and used to calculate a "Pair-based loss." The "XBM" likely serves to store and retrieve embeddings for contrastive learning or similar tasks. The enqueue and dequeue operations suggest a dynamic memory management strategy. The colors in the XBM and Top-k sample may represent different levels of confidence or relevance.