\n
## Diagram: System Architecture for Contrastive Learning
### Overview
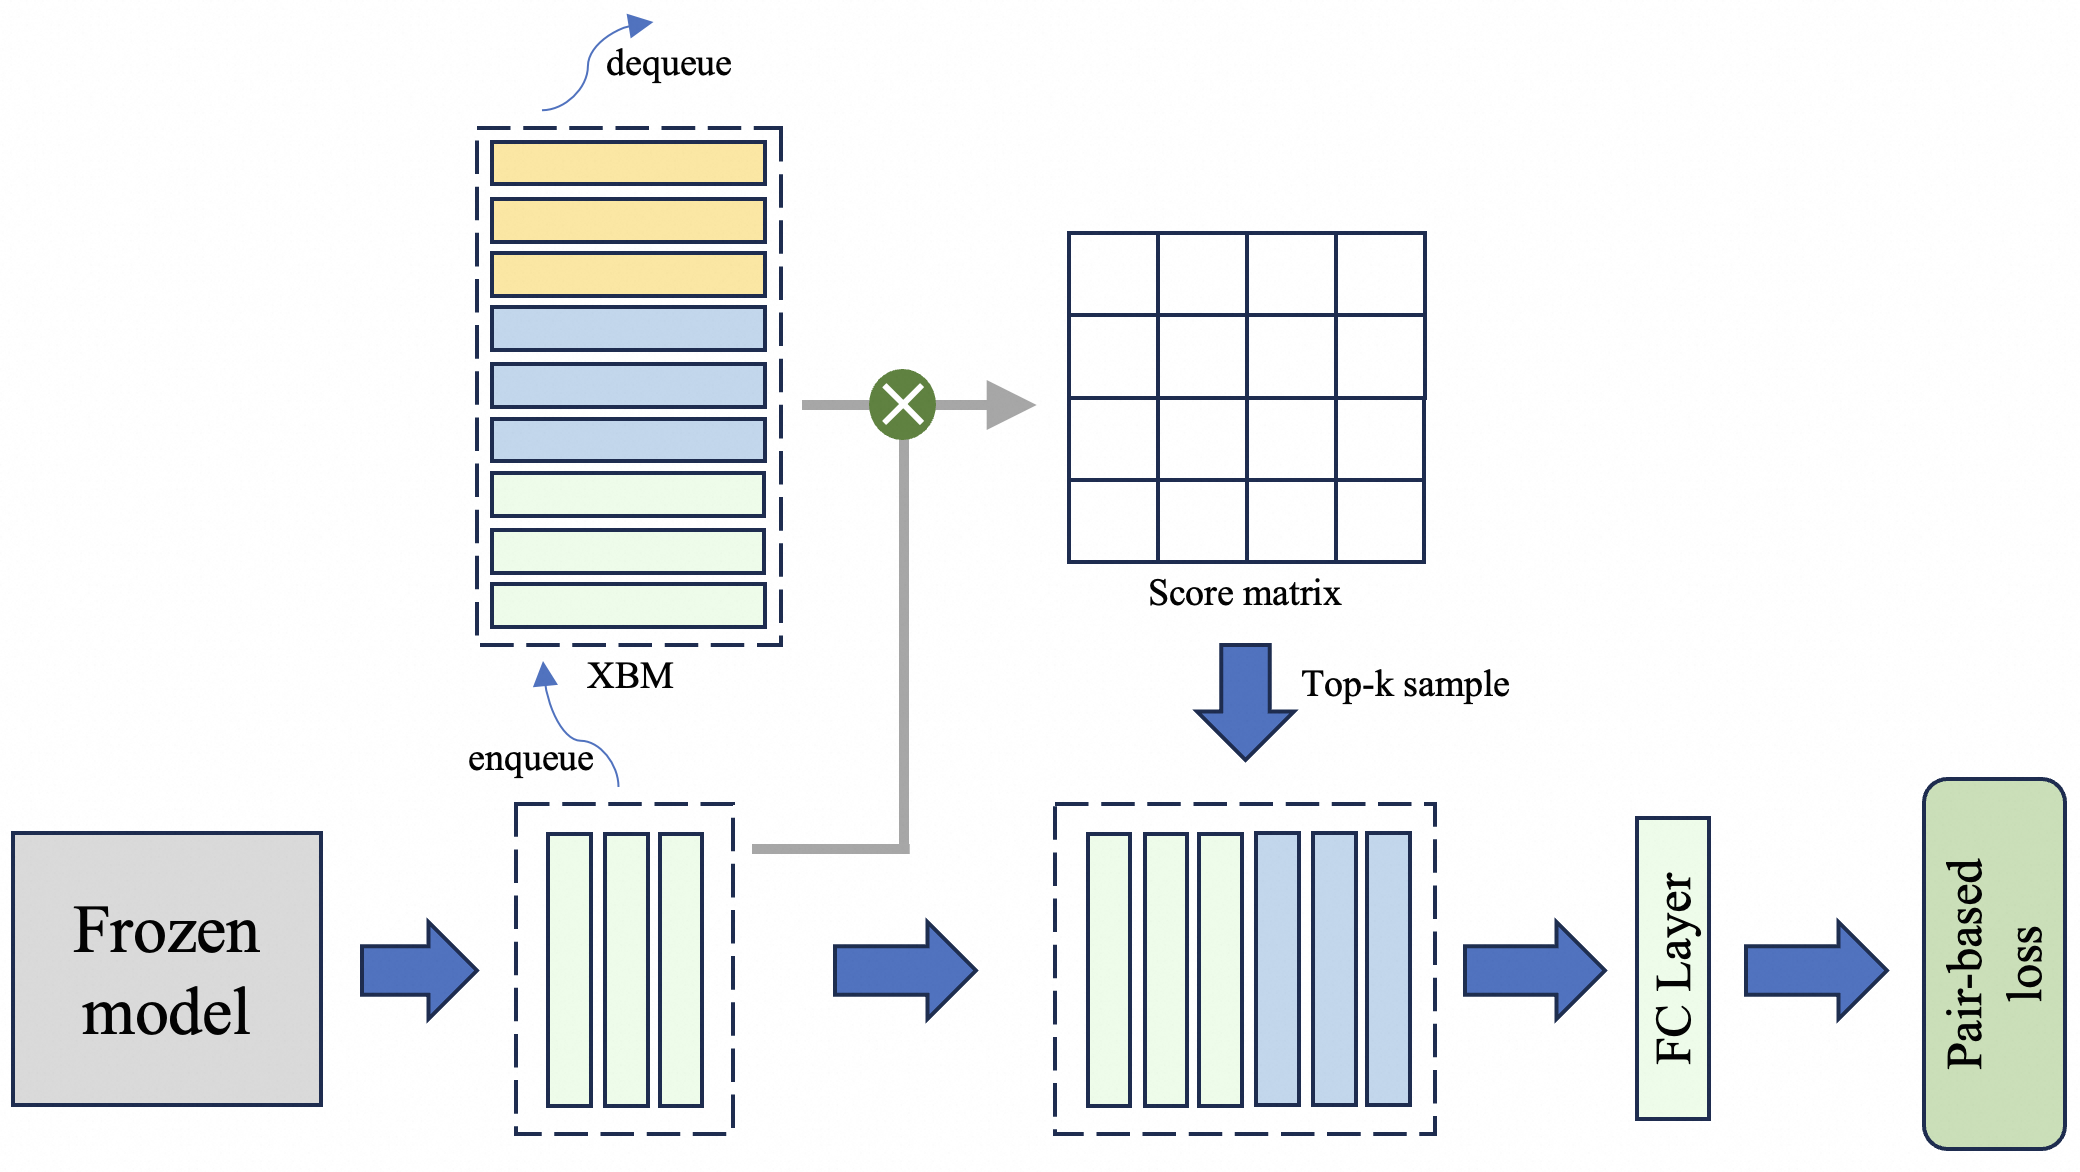
This diagram illustrates the architecture of a system employing contrastive learning, likely for a language or image model. The system utilizes a frozen model, an XBM (Cross-Batch Memory), a score matrix, and a top-k sampling mechanism, culminating in a fully connected (FC) layer and a pair-based loss function. The diagram depicts a data flow from left to right, with feedback loops involving the XBM.
### Components/Axes
The diagram consists of the following components:
* **Frozen model:** A pre-trained model whose weights are not updated during training.
* **XBM (Cross-Batch Memory):** A memory bank used to store and retrieve embeddings.
* **Score matrix:** A matrix representing the similarity scores between embeddings.
* **Top-k sample:** A sampling method that selects the top k most similar embeddings.
* **FC Layer:** A fully connected layer.
* **Pair-based loss:** A loss function that encourages similar embeddings to be close and dissimilar embeddings to be far apart.
* **dequeue:** An operation to remove elements from a queue.
* **enqueue:** An operation to add elements to a queue.
* Arrows indicate the direction of data flow.
* Dashed boxes represent processing blocks or memory structures.
### Detailed Analysis or Content Details
1. **Frozen Model:** Located on the bottom-left, the "Frozen model" is a gray square. An arrow indicates data flows *from* this model.
2. **Enqueue to XBM:** The output of the Frozen model is fed into a dashed box containing multiple rectangular blocks, representing embeddings. An arrow labeled "enqueue" points from the Frozen model output to this box.
3. **XBM:** The dashed box containing embeddings is labeled "XBM". An arrow labeled "dequeue" points *from* this box to a multiplication symbol (⊗).
4. **Score Matrix:** The output of the multiplication operation is fed into a grid-like structure labeled "Score matrix". This matrix appears to represent similarity scores between embeddings.
5. **Top-k Sample:** An arrow labeled "Top-k sample" points from the Score matrix to another dashed box containing embeddings.
6. **FC Layer:** The output of the Top-k sample is fed into a rectangular block labeled "FC Layer".
7. **Pair-based Loss:** The output of the FC Layer is fed into a rectangular block labeled "Pair-based loss". This represents the final loss calculation.
### Key Observations
* The XBM acts as a memory bank, storing embeddings from previous batches.
* The "dequeue" and "enqueue" operations suggest a queue-like structure for the XBM, allowing for continuous updates and retrieval of embeddings.
* The multiplication symbol (⊗) likely represents a dot product or other similarity calculation between embeddings.
* The system appears to be designed to learn representations that capture similarity between data points.
### Interpretation
This diagram depicts a contrastive learning framework. The frozen model generates embeddings, which are stored in the XBM. The XBM allows the model to compare embeddings from different batches, enabling it to learn more robust and generalizable representations. The score matrix quantifies the similarity between embeddings, and the top-k sampling mechanism focuses on the most relevant comparisons. The FC layer and pair-based loss function then optimize the embeddings to maximize similarity between positive pairs and minimize similarity between negative pairs. The use of a frozen model suggests that the system is focused on learning representations *without* modifying the underlying model weights, potentially for transfer learning or few-shot learning scenarios. The XBM is a key component, enabling the model to leverage information from past batches to improve its learning process. The entire architecture is designed to learn a meaningful embedding space where similar data points are close together and dissimilar data points are far apart.