## Flowchart: Machine Learning Pipeline with Pair-Based Loss
### Overview
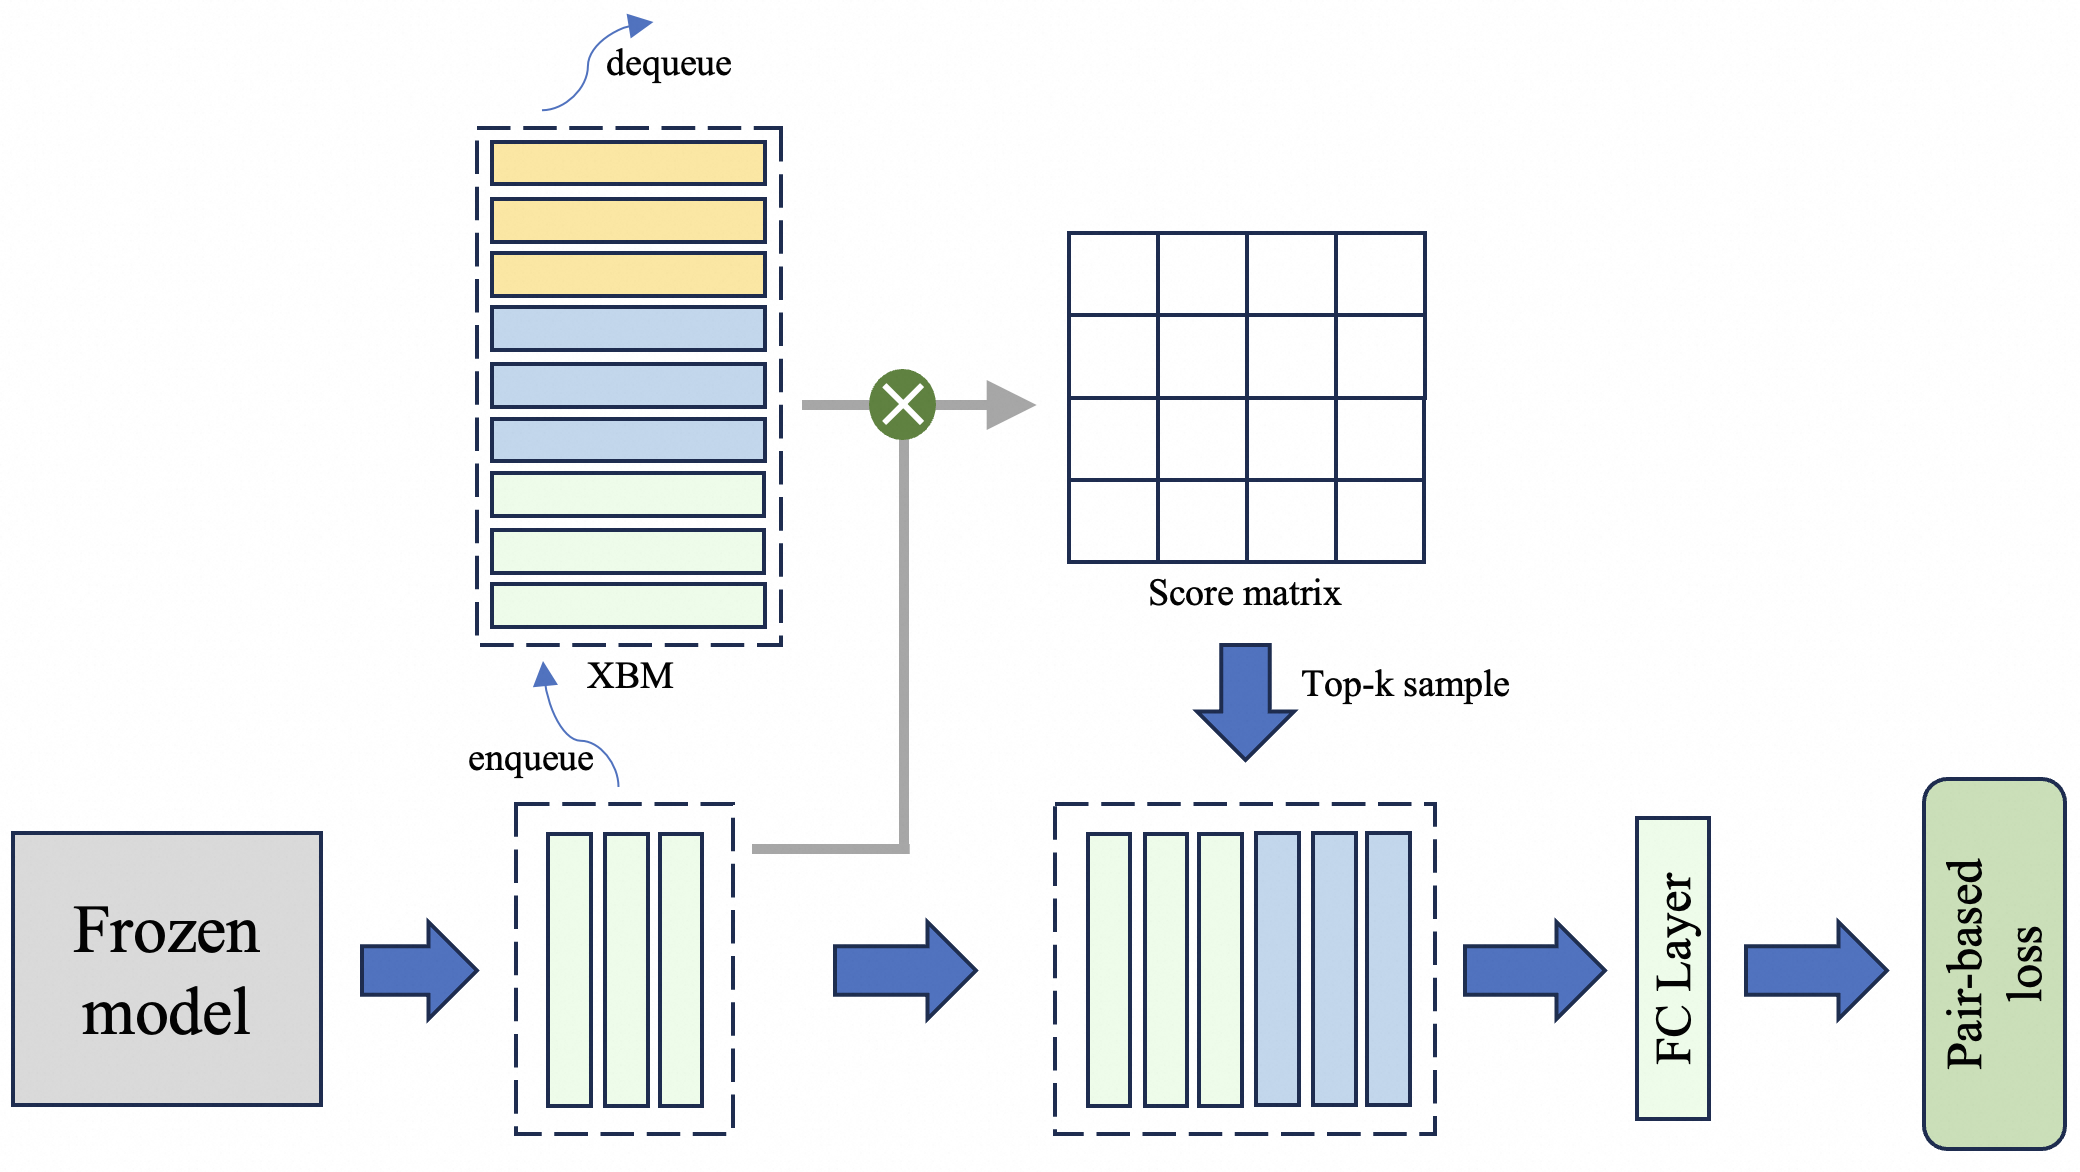
The diagram illustrates a machine learning pipeline involving a frozen model, data enqueueing/dequeueing processes, a score matrix, top-k sampling, and a fully connected (FC) layer leading to pair-based loss computation. The flow is directional, with components connected by arrows indicating data or control flow.
### Components/Axes
1. **Frozen Model** (gray box): Starting point of the pipeline.
2. **Enqueue** (blue arrow): Adds data to the XBM queue.
3. **XBM Queue** (blue dashed box): Contains multiple data blocks (orange, blue, green).
4. **Dequeue** (blue arrow with curved path): Removes data from the XBM queue.
5. **Score Matrix** (grid): Generates a matrix of scores.
6. **Top-k Sample** (blue arrow): Selects top-k elements from the score matrix.
7. **FC Layer** (light green box): Processes the top-k sample.
8. **Pair-Based Loss** (green box): Final output of the pipeline.
### Detailed Analysis
- **Frozen Model**: Positioned at the bottom-left, it feeds data into the enqueue process.
- **Enqueue**: Connects the frozen model to the XBM queue via a blue arrow. The XBM queue contains six data blocks (three orange, three blue, two green), suggesting batch processing.
- **XBM Queue**: Labeled explicitly, it acts as a buffer for incoming data.
- **Dequeue**: A curved arrow from the XBM queue to the score matrix indicates data retrieval. The dequeue process is visually distinct with a dashed outline.
- **Score Matrix**: A 4x4 grid representing pairwise comparisons or similarity scores.
- **Top-k Sample**: A downward arrow from the score matrix to the FC layer, implying selection of highest-scoring elements.
- **FC Layer**: Processes the top-k sample before passing it to the pair-based loss.
- **Pair-Based Loss**: Final component, colored green, indicating optimization target.
### Key Observations
1. **Color Coding**:
- Orange blocks in the XBM queue correspond to enqueued data.
- Blue blocks represent intermediate processing steps.
- Green blocks in the XBM queue and the final loss component suggest prioritization or finalization.
2. **Flow Direction**:
- Data flows from the frozen model → enqueue → XBM queue → dequeue → score matrix → top-k sample → FC layer → pair-based loss.
3. **Dashed vs. Solid Boxes**:
- Dashed boxes (XBM queue, score matrix) represent intermediate structures, while solid boxes (frozen model, FC layer, pair-based loss) denote fixed components.
### Interpretation
This pipeline likely implements a contrastive learning framework, where:
- The **frozen model** provides embeddings for input data.
- The **XBM queue** manages batch processing, with dequeueing enabling dynamic sampling.
- The **score matrix** computes pairwise similarities, and **top-k sampling** focuses on the most relevant pairs.
- The **FC layer** refines these pairs, and **pair-based loss** optimizes the model to maximize agreement between similar pairs and minimize it for dissimilar ones.
The use of a frozen model suggests transfer learning, while the XBM queue and dequeue mechanism imply efficient handling of large datasets. The pair-based loss aligns with methods like SimCLR or MoCo, emphasizing contrastive learning for tasks such as image retrieval or recommendation systems.