## Heatmaps: Similarity Matrices for Network Security Topic
### Overview
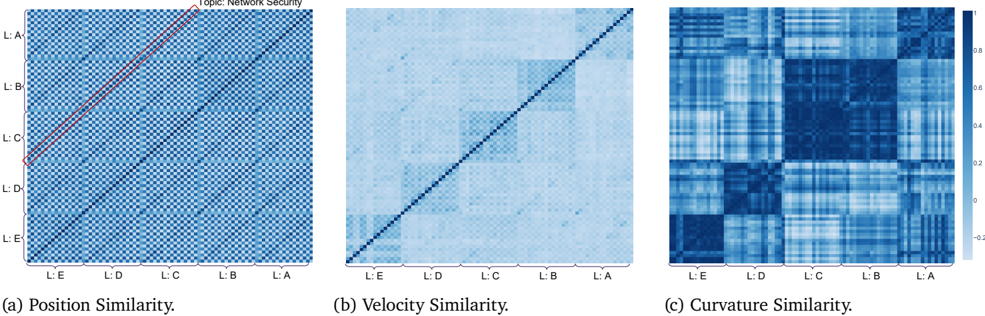
The image presents three heatmaps, labeled (a) Position Similarity, (b) Velocity Similarity, and (c) Curvature Similarity. Each heatmap visualizes a similarity matrix, likely representing the relationships between five entities labeled L:A, L:B, L:C, L:D, and L:E. The color intensity represents the degree of similarity, with a colorbar indicating a scale from approximately -0.4 to 0.8.
### Components/Axes
Each heatmap shares the same structure:
* **Axes:** Both the x-axis and y-axis are labeled with the entities L:A, L:B, L:C, L:D, and L:E.
* **Colorbar:** A colorbar is present on the right side of each heatmap, ranging from dark blue (approximately -0.4) to white (approximately 0.0) to light yellow/orange (approximately 0.8).
* **Title:** Each heatmap has a title indicating the type of similarity being visualized: Position, Velocity, or Curvature.
* **Topic:** A general topic is indicated at the top of the first heatmap: "Topic: Network Security".
### Detailed Analysis or Content Details
**a) Position Similarity:**
* **Trend:** A strong diagonal line of high similarity (light yellow/orange) runs from the top-left to the bottom-right. This indicates that each entity is most similar to itself. Above the diagonal, the similarity values are generally low (dark blue). Below the diagonal, there is a clear red line indicating a strong positive correlation between L:A and L:B, L:B and L:C, L:C and L:D, and L:D and L:E.
* **Data Points (approximate):**
* L:A - L:A: ~0.8
* L:B - L:B: ~0.8
* L:C - L:C: ~0.8
* L:D - L:D: ~0.8
* L:E - L:E: ~0.8
* L:A - L:B: ~0.2
* L:B - L:A: ~0.2
* L:B - L:C: ~0.2
* L:C - L:B: ~0.2
* L:C - L:D: ~0.2
* L:D - L:C: ~0.2
* L:D - L:E: ~0.2
* L:E - L:D: ~0.2
**b) Velocity Similarity:**
* **Trend:** A strong diagonal line of high similarity (light yellow/orange) runs from the top-left to the bottom-right, similar to the Position Similarity heatmap. The values above and below the diagonal are generally lower and more diffuse than in the Position Similarity heatmap, with a gradient of similarity decreasing as you move away from the diagonal.
* **Data Points (approximate):**
* L:A - L:A: ~0.8
* L:B - L:B: ~0.8
* L:C - L:C: ~0.8
* L:D - L:D: ~0.8
* L:E - L:E: ~0.8
* L:A - L:B: ~0.4
* L:B - L:A: ~0.4
* L:A - L:C: ~0.2
* L:C - L:A: ~0.2
**c) Curvature Similarity:**
* **Trend:** This heatmap exhibits a more complex pattern. While the diagonal still shows high similarity (light yellow/orange), there are noticeable alternating bands of positive and negative similarity (blue and yellow) running both horizontally and vertically. This suggests a more nuanced relationship between the entities based on curvature.
* **Data Points (approximate):**
* L:A - L:A: ~0.8
* L:B - L:B: ~0.8
* L:C - L:C: ~0.8
* L:D - L:D: ~0.8
* L:E - L:E: ~0.8
* L:A - L:B: ~0.2
* L:B - L:A: ~0.2
* L:A - L:C: ~-0.2
* L:C - L:A: ~-0.2
### Key Observations
* All three heatmaps exhibit high self-similarity (diagonal).
* Position Similarity shows a clear sequential relationship between L:A, L:B, L:C, L:D, and L:E.
* Velocity Similarity shows a more gradual decrease in similarity as entities become less related.
* Curvature Similarity displays the most complex pattern, with alternating positive and negative correlations.
### Interpretation
These heatmaps likely represent the similarity of different network security components (L:A through L:E) based on their position, velocity (rate of change), and curvature (acceleration) within a network. The "Topic: Network Security" suggests these entities could be network packets, intrusion detection signatures, or other security-related elements.
* **Position Similarity** indicates which components are located close to each other in the network topology or in a data stream. The strong sequential relationship suggests a linear flow or dependency between these components.
* **Velocity Similarity** shows which components exhibit similar rates of change. This could be useful for identifying coordinated attacks or anomalies.
* **Curvature Similarity** reveals which components have similar acceleration patterns. This could indicate more subtle relationships or complex interactions.
The alternating bands in the Curvature Similarity heatmap suggest that some components might be reacting in opposite ways to the same network events, potentially indicating a defensive mechanism or a complex attack pattern. The differences between the three similarity measures highlight the importance of considering multiple dimensions when analyzing network security data. The data suggests that the network security components are not entirely independent, and their relationships vary depending on the metric used to assess similarity.