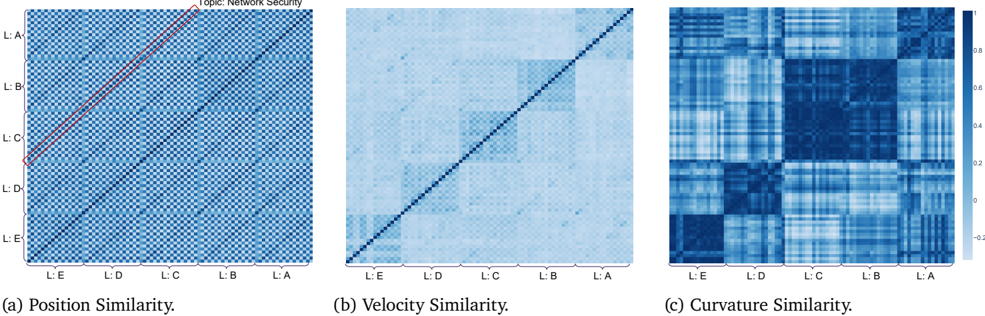
## Heatmap Visualization: Position, Velocity, and Curvature Similarity Analysis
### Overview
The image presents three heatmaps comparing similarity metrics across five labeled locations (L:A to L:E). Each heatmap uses a blue gradient scale (0 to 1) to represent similarity strength, with darker blue indicating higher similarity. The heatmaps are titled "Position Similarity," "Velocity Similarity," and "Curvature Similarity," with distinct visual patterns in each.
---
### Components/Axes
- **X/Y Axes**: Labeled L:A (top-left) to L:E (bottom-right) for all heatmaps.
- **Color Scale**: Right-aligned legend with values from 0 (light blue) to 1 (dark blue).
- **Annotations**:
- **Position Similarity (a)**: Red line connecting L:C → L:B → L:A.
- **Velocity Similarity (b)**: Diagonal line from L:E → L:A.
- **Curvature Similarity (c)**: Checkerboard pattern with alternating dark/light blue blocks.
---
### Detailed Analysis
#### (a) Position Similarity
- **Pattern**: Red line diagonally spans from L:C (bottom-left) to L:A (top-right), suggesting a dominant similarity trend along this path.
- **Values**:
- L:C ↔ L:A: ~0.9 (dark blue)
- L:B ↔ L:A: ~0.8 (medium blue)
- Other off-diagonal values: ~0.3–0.6 (lighter blue).
#### (b) Velocity Similarity
- **Pattern**: Diagonal line from L:E (bottom-left) to L:A (top-right), indicating self-similarity (e.g., L:A ↔ L:A = 1.0).
- **Values**:
- Diagonal: All ~1.0 (dark blue).
- Off-diagonal: Gradual decrease from ~0.7 (L:E ↔ L:D) to ~0.2 (L:A ↔ L:E).
#### (c) Curvature Similarity
- **Pattern**: Checkerboard alternates between dark blue (high similarity) and light blue (low similarity).
- **Values**:
- High similarity clusters: L:C ↔ L:B (~0.8), L:D ↔ L:C (~0.7).
- Low similarity: L:A ↔ L:E (~0.1), L:B ↔ L:E (~0.2).
---
### Key Observations
1. **Position Similarity** emphasizes a strong connection between L:C, L:B, and L:A, with diminishing similarity toward L:D and L:E.
2. **Velocity Similarity** shows perfect self-similarity (diagonal) and weaker pairwise similarities, suggesting location-specific velocity profiles.
3. **Curvature Similarity** reveals alternating high/low similarity between adjacent locations, possibly indicating periodic or opposing curvature patterns.
---
### Interpretation
- **Position Similarity** (a) likely highlights a critical pathway or alignment between L:C, L:B, and L:A, possibly related to network topology or spatial constraints.
- **Velocity Similarity** (b) suggests that velocity metrics are location-dependent, with minimal cross-location correlation.
- **Curvature Similarity** (c) implies alternating curvature characteristics between locations, which could reflect structural or dynamic differences in the network.
The heatmaps collectively indicate that positional alignment drives similarity in position metrics, while velocity and curvature exhibit distinct, location-specific patterns. The red line in (a) may represent a prioritized route or boundary in network security analysis.