# Technical Document Extraction: Line Graph Analysis
## Image Description
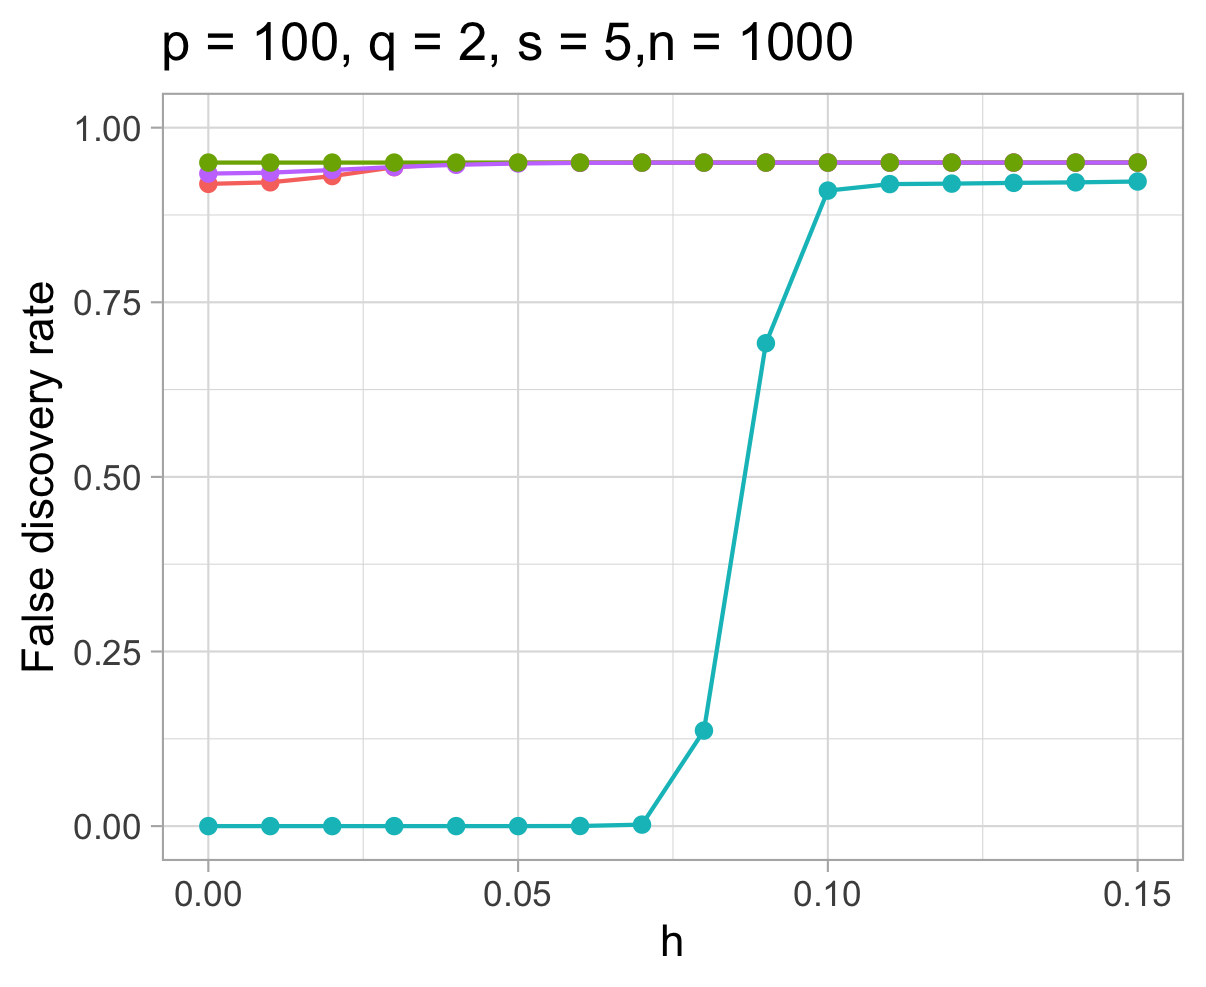
The image is a line graph titled **"p = 100, q = 2, s = 5, n = 1000"**. It visualizes the relationship between the variable **h** (x-axis) and **False discovery rate** (y-axis). Three data series are plotted, differentiated by color and labeled in the legend.
---
## Key Components
### 1. **Axis Labels and Titles**
- **X-axis**: Labeled **"h"**, ranging from **0.00** to **0.15** in increments of **0.05**.
- **Y-axis**: Labeled **"False discovery rate"**, ranging from **0.00** to **1.00** in increments of **0.25**.
### 2. **Legend**
- Located at the **top-right corner** of the graph.
- **Color-to-label mapping**:
- **Red**: Method A
- **Purple**: Method B
- **Green**: Method C
### 3. **Data Series**
#### **Method A (Red Line)**
- **Trend**: Flat line starting at **~0.95** and remaining constant across all **h** values.
- **Data Points**:
- h = 0.00: 0.95
- h = 0.05: 0.95
- h = 0.10: 0.95
- h = 0.15: 0.95
#### **Method B (Purple Line)**
- **Trend**: Slight upward slope from **~0.94** at h = 0.00 to **~0.98** at h = 0.15, then plateaus.
- **Data Points**:
- h = 0.00: 0.94
- h = 0.05: 0.96
- h = 0.10: 0.98
- h = 0.15: 0.98
#### **Method C (Green Line)**
- **Trend**: Flat at **0.00** until h = 0.08, then a sharp vertical increase to **~0.95**, remaining constant thereafter.
- **Data Points**:
- h = 0.00: 0.00
- h = 0.05: 0.00
- h = 0.08: 0.00 → 0.95 (sharp increase)
- h = 0.10: 0.95
- h = 0.15: 0.95
---
## Observations
1. **Method A** maintains a consistently high false discovery rate (~0.95) regardless of **h**.
2. **Method B** shows a gradual increase in false discovery rate as **h** increases, stabilizing near 0.98.
3. **Method C** exhibits a threshold behavior: no false discoveries until **h = 0.08**, after which the rate jumps to ~0.95 and remains constant.
---
## Notes
- No embedded text or data tables are present in the image.
- All legend colors match the corresponding data series exactly.
- The graph does not include error bars or confidence intervals.
---
## Conclusion
The graph compares three methods (A, B, C) for false discovery rate across varying **h** values. Method C demonstrates a distinct threshold effect, while Methods A and B show minimal sensitivity to **h**.