## Scatter Plot and Bar Chart: Frontier Reward Modeling Performance and Reinforcement Learning Results
### Overview
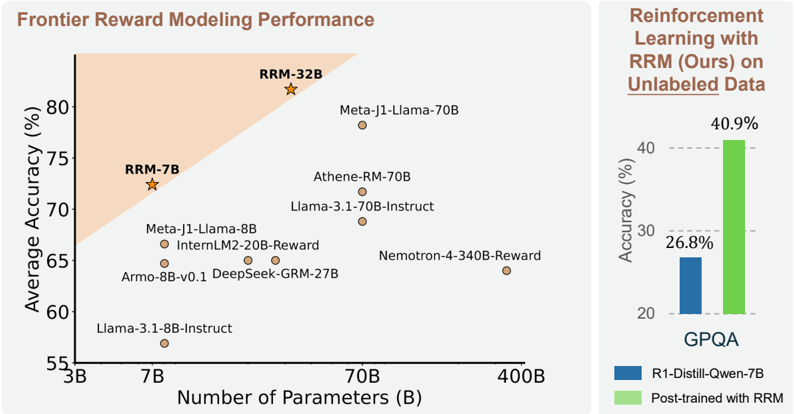
The image presents two charts. The first is a scatter plot comparing the average accuracy of various language models against the number of parameters. The second is a bar chart comparing the accuracy of a model before and after post-training with RRM on unlabeled data.
### Components/Axes
**Scatter Plot (Left)**
* **Title:** Frontier Reward Modeling Performance
* **X-axis:** Number of Parameters (B)
* Scale: 3B, 7B, 70B, 400B (Logarithmic scale implied)
* **Y-axis:** Average Accuracy (%)
* Scale: 55%, 60%, 65%, 70%, 75%, 80%
* **Data Points:** Represent different language models.
* RRM-32B (Star symbol)
* RRM-7B (Star symbol)
* Meta-J1-Llama-70B (Circle)
* Athene-RM-70B (Circle)
* Llama-3.1-70B-Instruct (Circle)
* Meta-J1-Llama-8B (Circle)
* InternLM2-20B-Reward (Circle)
* Nemotron-4-340B-Reward (Circle)
* Armo-8B-v0.1 (Circle)
* DeepSeek-GRM-27B (Circle)
* Llama-3.1-8B-Instruct (Circle)
* **Highlighted Region:** An area shaded in light orange, encompassing the top-left portion of the plot.
**Bar Chart (Right)**
* **Title:** Reinforcement Learning with RRM (Ours) on Unlabeled Data
* **Y-axis:** Accuracy (%)
* Scale: 20%, 30%, 40%
* **X-axis:** GPQA (Single category)
* **Bars:**
* Blue: R1-Distill-Qwen-7B
* Green: Post-trained with RRM
### Detailed Analysis
**Scatter Plot**
* **RRM-32B:** Located at approximately (50B, 83%).
* **RRM-7B:** Located at approximately (7B, 73%).
* **Meta-J1-Llama-70B:** Located at approximately (70B, 72%).
* **Athene-RM-70B:** Located at approximately (70B, 70%).
* **Llama-3.1-70B-Instruct:** Located at approximately (70B, 69%).
* **Meta-J1-Llama-8B:** Located at approximately (8B, 67%).
* **InternLM2-20B-Reward:** Located at approximately (20B, 66%).
* **Nemotron-4-340B-Reward:** Located at approximately (340B, 64%).
* **Armo-8B-v0.1:** Located at approximately (8B, 64%).
* **DeepSeek-GRM-27B:** Located at approximately (27B, 64%).
* **Llama-3.1-8B-Instruct:** Located at approximately (8B, 57%).
**Bar Chart**
* **R1-Distill-Qwen-7B (Blue):** Accuracy of 26.8%.
* **Post-trained with RRM (Green):** Accuracy of 40.9%.
### Key Observations
* The scatter plot shows a general trend of increasing accuracy with the number of parameters, but with significant variance.
* RRM-32B and RRM-7B, indicated by star symbols, appear to outperform other models with similar parameter counts.
* The bar chart demonstrates a significant improvement in accuracy after post-training with RRM.
### Interpretation
The scatter plot suggests that while increasing the number of parameters generally improves model accuracy, the architecture and training method (indicated by the RRM models) play a crucial role in achieving higher performance. The shaded region might represent a target performance area. The bar chart clearly shows the effectiveness of RRM in improving the accuracy of a language model through post-training on unlabeled data. The increase from 26.8% to 40.9% indicates a substantial performance gain.