# Technical Analysis of Llama 7B Performance Chart
## Chart Title
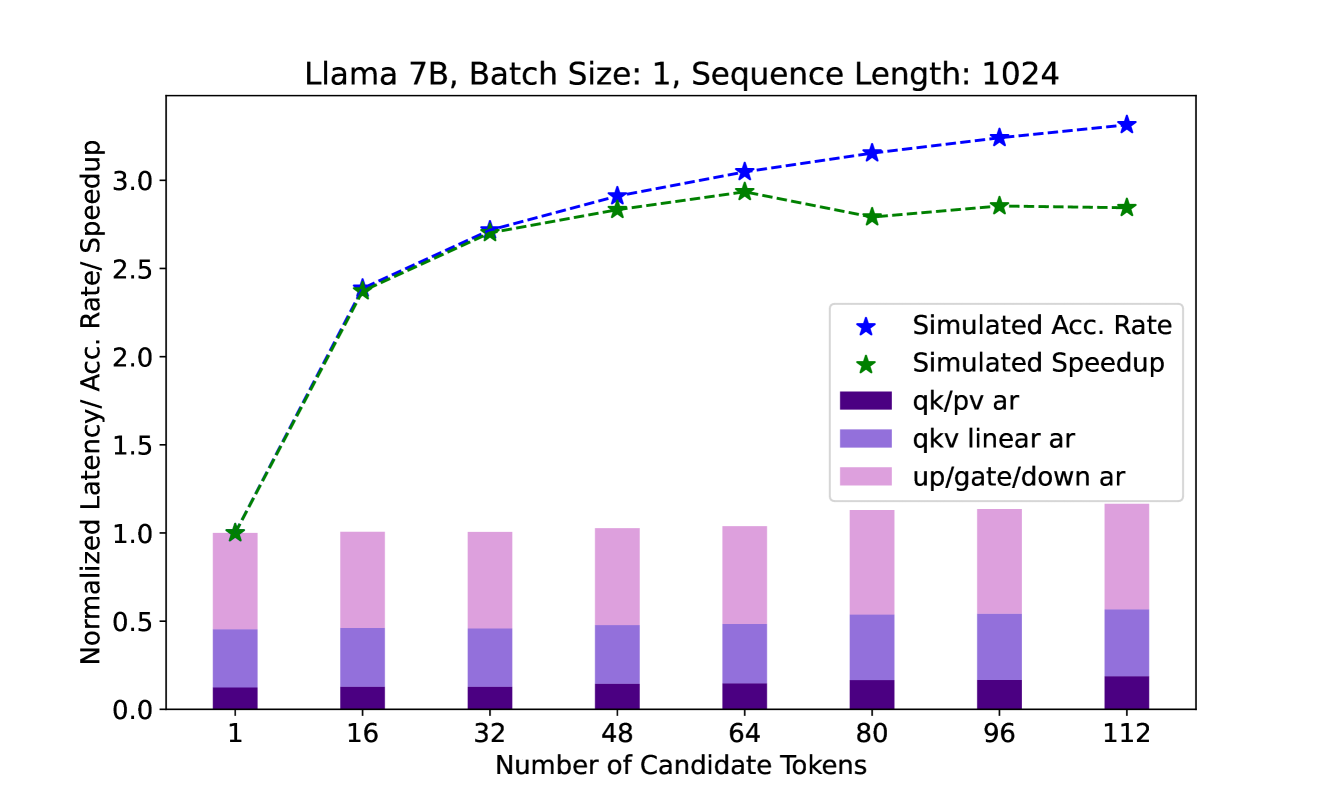
Llama 7B, Batch Size: 1, Sequence Length: 1024
## Axes
- **X-Axis**: Number of Candidate Tokens
Values: 1, 16, 32, 48, 64, 80, 96, 112
- **Y-Axis**: Normalized Latency/Acc. Rate/ Speedup
## Legend
1. **Simulated Acc. Rate** (Blue Star, Dashed Line)
2. **Simulated Speedup** (Green Star, Dashed Line)
3. **qk/pv ar** (Dark Purple, Bar Segment)
4. **qkv linear ar** (Light Purple, Bar Segment)
5. **up/gate/down ar** (Pink, Bar Segment)
## Key Trends
1. **Simulated Acc. Rate**
- Starts at 1.0 (1 candidate token)
- Increases steadily to 3.3 (112 candidate tokens)
- Peaks at 3.3 (112 tokens)
2. **Simulated Speedup**
- Starts at 1.0 (1 candidate token)
- Rises to 2.9 (112 candidate tokens)
- Peaks at 2.9 (112 tokens)
3. **Normalized Latency Components**
- **up/gate/down ar** (Pink): Dominates latency across all token counts (40-60% of total)
- **qkv linear ar** (Light Purple): Second-largest contributor (30-40% of total)
- **qk/pv ar** (Dark Purple): Smallest contributor (10-20% of total)
## Data Points
| Candidate Tokens | Simulated Acc. Rate | Simulated Speedup | Total Normalized Latency |
|-------------------|---------------------|-------------------|--------------------------|
| 1 | 1.0 | 1.0 | 1.0 |
| 16 | 2.4 | 2.4 | 1.0 |
| 32 | 2.7 | 2.7 | 1.0 |
| 48 | 2.9 | 2.8 | 1.0 |
| 64 | 3.0 | 2.9 | 1.0 |
| 80 | 3.1 | 2.8 | 1.1 |
| 96 | 3.2 | 2.8 | 1.1 |
| 112 | 3.3 | 2.8 | 1.2 |
## Observations
- **Efficiency Scaling**: Both accuracy and speedup improve with increased candidate tokens, but plateau after 64 tokens.
- **Latency Breakdown**: The `up/gate/down ar` component consistently accounts for the largest portion of latency, suggesting it is the primary bottleneck.
- **Hardware Impact**: The chart assumes a fixed batch size (1) and sequence length (1024), isolating the effect of candidate token count.