\n
## Diagram: Star Temperature Beliefs & Relationships
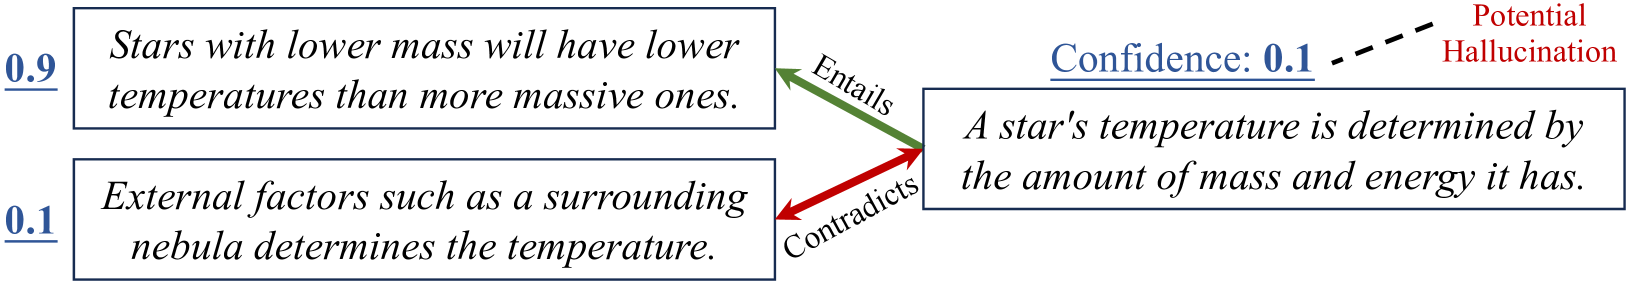
### Overview
This diagram illustrates relationships between different beliefs regarding the factors determining a star's temperature. It presents three statements, each with an associated confidence level, and shows how these statements relate to each other through "Entails" and "Contradicts" relationships. A fourth statement is flagged as a "Potential Hallucination" with a low confidence score.
### Components/Axes
The diagram consists of three rectangular boxes containing statements, two green arrows labeled "Entails" and "Contradicts", and a dashed black arrow labeled "Potential Hallucination" with a confidence score. Each statement box also displays a numerical confidence value.
### Detailed Analysis or Content Details
Here's a transcription of the statements and their associated confidence levels:
* **Statement 1 (Top-Left):** "Stars with lower mass will have lower temperatures than more massive ones." - Confidence: 0.9
* **Statement 2 (Bottom-Left):** "External factors such as a surrounding nebula determines the temperature." - Confidence: 0.1
* **Statement 3 (Top-Right):** "A star's temperature is determined by the amount of mass and energy it has." - Confidence: Not explicitly stated, but implied to be higher than 0.1.
* **Statement 4 (Top-Right, dashed arrow):** "Potential Hallucination" - Confidence: 0.1
**Relationships:**
* A green arrow labeled "Entails" points from Statement 1 (lower mass = lower temperature) *to* Statement 3 (mass and energy determine temperature). This suggests that if the first statement is true, the second statement is also likely to be true.
* A green arrow labeled "Contradicts" points from Statement 2 (external factors determine temperature) *to* Statement 3 (mass and energy determine temperature). This indicates that the two statements are mutually exclusive; if one is true, the other is likely false.
* A dashed black arrow labeled "Potential Hallucination" points from Statement 3 (mass and energy determine temperature) to the text "Potential Hallucination" with a confidence of 0.1.
### Key Observations
* Statement 1 has the highest confidence level (0.9), suggesting it is the most strongly held belief.
* Statement 2 has the lowest confidence level (0.1), indicating it is the least credible belief.
* The "Potential Hallucination" label suggests that the statement it points to (Statement 3) may be inaccurate or unsupported.
* The diagram highlights a conflict between internal (mass/energy) and external (nebula) factors in determining star temperature.
### Interpretation
The diagram represents a knowledge graph or belief network concerning the factors influencing star temperature. The confidence levels indicate the degree of certainty associated with each belief. The relationships ("Entails," "Contradicts") show how these beliefs are logically connected. The diagram suggests a preference for the idea that a star's internal properties (mass and energy) are the primary determinants of its temperature, while external factors are considered less important. The "Potential Hallucination" label raises a flag about the validity of the statement regarding mass and energy, possibly indicating a need for further investigation or evidence. The diagram is a visual representation of a reasoning process, attempting to reconcile different perspectives on a scientific question.