# Technical Document Extraction: Scatter Plot Analysis
## Axis Labels and Titles
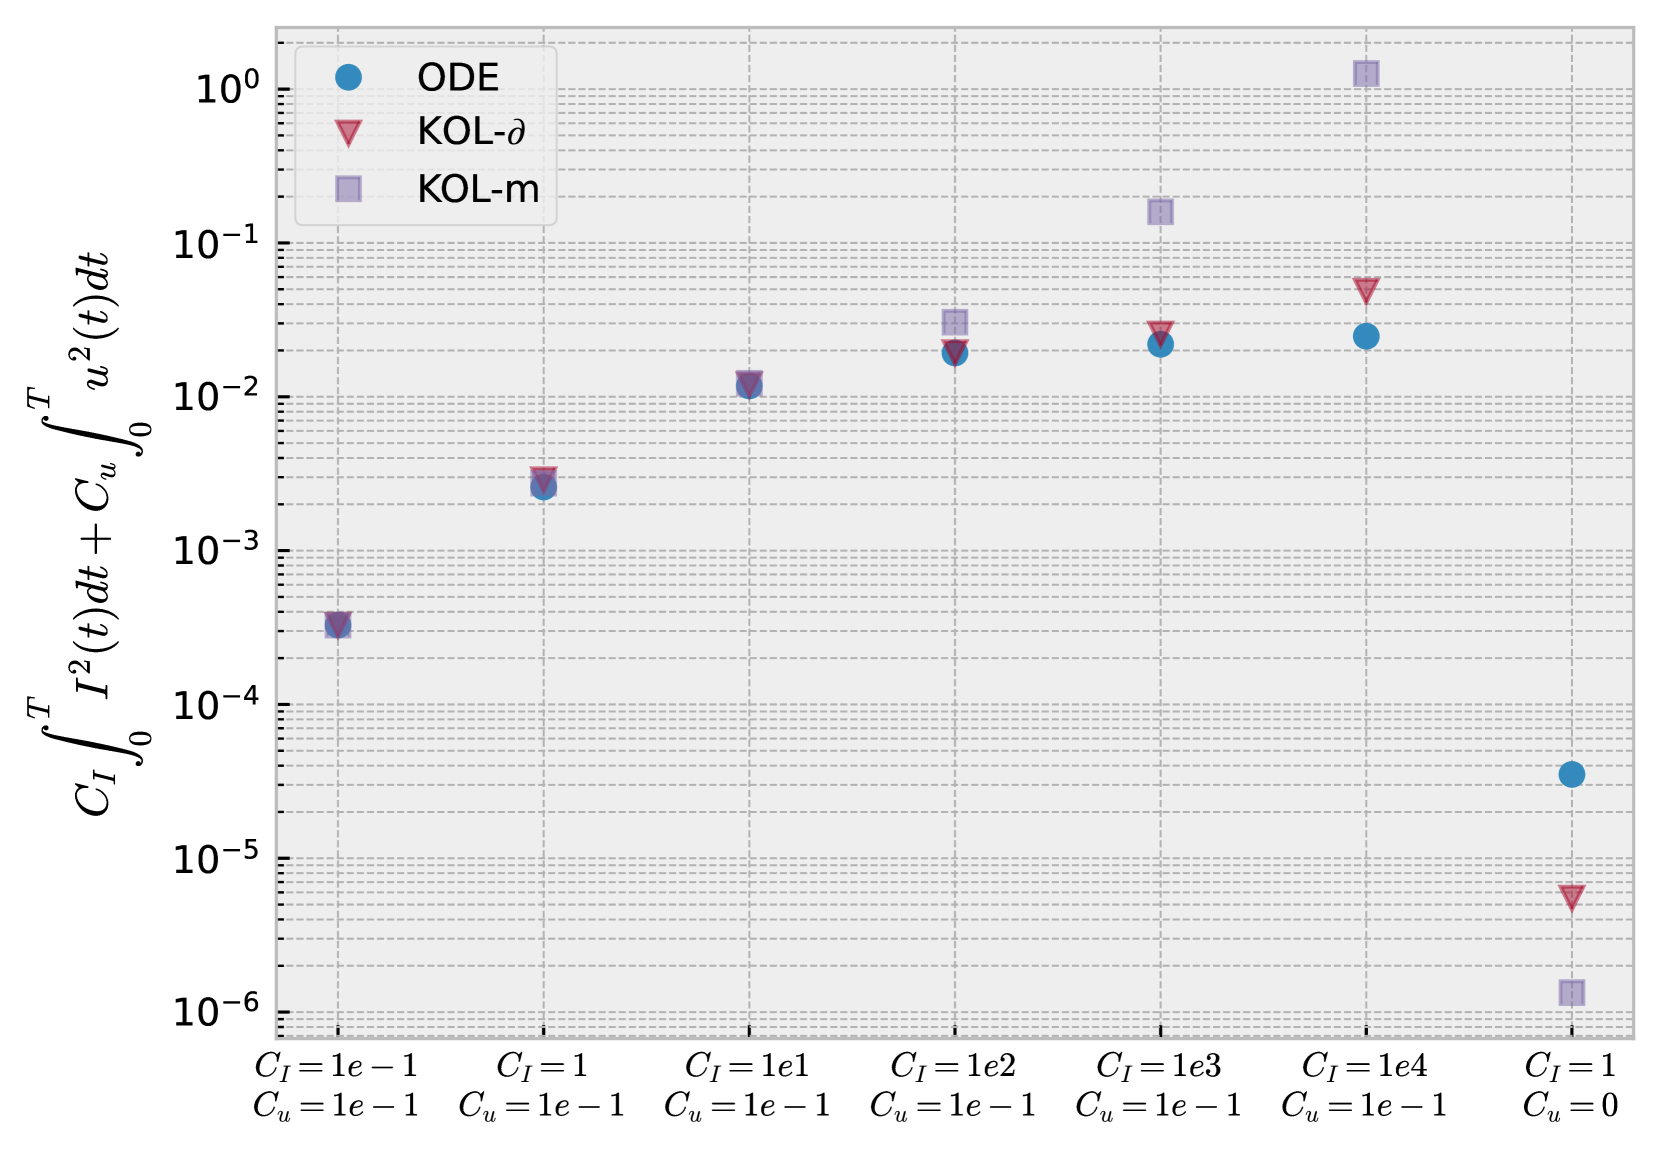
- **Y-Axis**:
$ C_I \int_0^T I^2(t)dt + C_u \int_0^T u^2(t)dt $
(Logarithmic scale: $ 10^{-6} $ to $ 10^0 $)
- **X-Axis**:
Categories for $ C_I $ and $ C_u $:
- $ C_I = 1e-1, 1, 1e1, 1e2, 1e3, 1e4, 1 $
- $ C_u = 1e-1, 1e-1, 1e-1, 1e-1, 1e-1, 1e-1, 0 $
## Legend
- **ODE**: Blue circles (●)
- **KOL-δ**: Red triangles (▼)
- **KOL-m**: Purple squares (■)
## Data Points
| $ C_I $ | $ C_u $ | ODE (●) | KOL-δ (▼) | KOL-m (■) |
|----------|----------|---------|-----------|-----------|
| 1e-1 | 1e-1 | 1e-4 | 1e-4 | 1e-4 |
| 1 | 1e-1 | 1e-3 | 1e-3 | 1e-3 |
| 1e1 | 1e-1 | 1e-2 | 1e-2 | 1e-2 |
| 1e2 | 1e-1 | 1e-1 | 1e-1 | 1e-1 |
| 1e3 | 1e-1 | 1e-1 | 1e-1 | 1e-1 |
| 1e4 | 1e-1 | 1e-1 | 1e-1 | 1e-1 |
| 1 | 0 | 1e-5 | 1e-6 | 1e-7 |
## Key Observations
1. **ODE (●)**:
- Data points decrease in magnitude as $ C_I $ increases.
- At $ C_I = 1 $, $ C_u = 0 $, the value drops to $ 10^{-5} $.
2. **KOL-δ (▼)**:
- Similar trend to ODE but with slightly lower values at $ C_I = 1 $, $ C_u = 0 $ ($ 10^{-6} $).
3. **KOL-m (■)**:
- Highest values at $ C_I = 1e4 $, $ C_u = 1e-1 $ ($ 10^{-1} $).
- At $ C_I = 1 $, $ C_u = 0 $, the value is $ 10^{-7} $, the lowest among all methods.
## Grid and Formatting
- Dashed grid lines for reference.
- Logarithmic y-axis ensures exponential scale representation.
- X-axis categories are explicitly labeled with $ C_I $ and $ C_u $ values.