## Heatmaps: Position and Velocity Similarity
### Overview
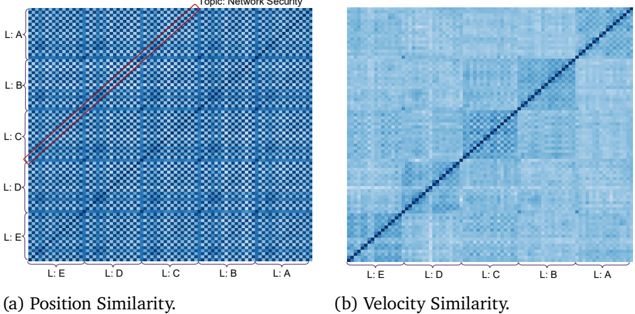
The image presents two heatmaps, (a) Position Similarity and (b) Velocity Similarity, related to the topic of Network Security. Both heatmaps display similarity matrices, with axes labeled L: A through L: E. The heatmaps use a blue color gradient to represent similarity, with darker shades indicating higher similarity. A red line is drawn on the Position Similarity heatmap.
### Components/Axes
* **Title:** The image is titled with the topic "Topic: Network Security" in the top-right corner of the first heatmap.
* **Heatmap (a) Title:** "(a) Position Similarity." is written below the first heatmap.
* **Heatmap (b) Title:** "(b) Velocity Similarity." is written below the second heatmap.
* **Axes Labels:** Both heatmaps have axes labeled L: A, L: B, L: C, L: D, and L: E on both the horizontal (bottom) and vertical (left) axes.
* **Color Gradient:** The heatmaps use a blue color gradient, where darker blue represents higher similarity and lighter blue represents lower similarity.
### Detailed Analysis
#### Heatmap (a): Position Similarity
* **Overall Pattern:** The heatmap shows a block-like structure, with distinct regions of higher and lower similarity.
* **Red Line:** A red line is drawn from the top-left corner (L: A, L: E) to approximately the center of the heatmap.
* **Specific Observations:**
* The region corresponding to L: A and L: B shows high similarity (darker blue).
* The region corresponding to L: D and L: E shows high similarity (darker blue).
* The region corresponding to L: A and L: A shows high similarity (darker blue).
* The region corresponding to L: E and L: E shows high similarity (darker blue).
#### Heatmap (b): Velocity Similarity
* **Overall Pattern:** The heatmap shows a strong diagonal pattern, indicating high similarity between the same labels (L: A with L: A, L: B with L: B, etc.).
* **Diagonal:** A dark blue diagonal line runs from the bottom-left (L: E, L: E) to the top-right (L: A, L: A), indicating high similarity between identical labels.
* **Specific Observations:**
* The diagonal elements (L: A to L: A, L: B to L: B, etc.) are the darkest blue, indicating the highest similarity.
* Off-diagonal elements generally show lower similarity (lighter blue).
* There are some off-diagonal regions with slightly higher similarity, but they are less pronounced than the diagonal.
### Key Observations
* **Position Similarity:** Shows distinct clusters of similarity between different labels, suggesting certain positions are more related than others.
* **Velocity Similarity:** Shows a strong correlation between the same labels, indicating that velocity is highly similar for identical labels.
### Interpretation
The heatmaps provide insights into the similarity of positions and velocities within the context of Network Security. The Position Similarity heatmap suggests that certain positions (represented by labels L: A through L: E) exhibit higher similarity, potentially indicating related network locations or functions. The Velocity Similarity heatmap highlights that the velocity characteristics are most similar for the same labels, which is expected but confirms the data's validity. The red line on the Position Similarity heatmap might be highlighting a specific threshold or comparison point. The differences between the two heatmaps suggest that position and velocity provide different perspectives on network behavior and relationships.