\n
## Heatmaps: Position and Velocity Similarity - Network Security Topic
### Overview
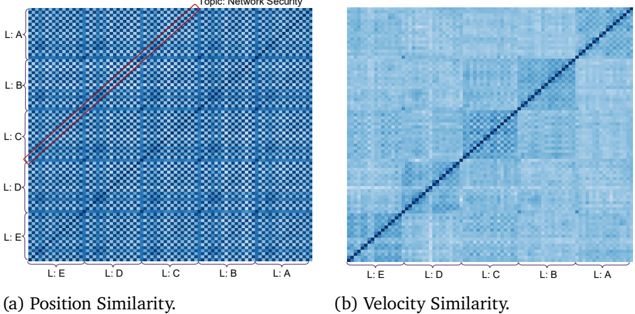
The image presents two heatmaps, labeled (a) Position Similarity and (b) Velocity Similarity, related to the topic of Network Security. Both heatmaps utilize a color gradient to represent similarity levels, with darker shades indicating higher similarity and lighter shades indicating lower similarity. The axes of both heatmaps are labeled L:A through L:E.
### Components/Axes
Both heatmaps share the following components:
* **Axes Labels:** Both the x-axis and y-axis are labeled with "L:A", "L:B", "L:C", "L:D", and "L:E". These labels likely represent different layers or components within a network security system.
* **Color Scale:** A gradient from light blue to dark blue is used. Darker blue indicates higher similarity, while lighter blue indicates lower similarity.
* **Title:** The overall topic is "Network Security" displayed at the top-right of the image.
* **Sub-Titles:** Each heatmap has a subtitle indicating the type of similarity being measured: "(a) Position Similarity" and "(b) Velocity Similarity".
### Detailed Analysis or Content Details
**Heatmap (a): Position Similarity**
* **Trend:** A strong diagonal trend is visible, with the darkest blue color concentrated along a line running from the top-left corner (L:A, L:A) to the bottom-right corner (L:E, L:E). This indicates high position similarity between components with the same layer label.
* **Data Points (Approximate):**
* L:A vs L:A: Very dark blue (Similarity ~ 90-100%)
* L:B vs L:B: Very dark blue (Similarity ~ 90-100%)
* L:C vs L:C: Very dark blue (Similarity ~ 90-100%)
* L:D vs L:D: Very dark blue (Similarity ~ 90-100%)
* L:E vs L:E: Very dark blue (Similarity ~ 90-100%)
* L:A vs L:B: Medium blue (Similarity ~ 40-60%)
* L:A vs L:C: Light blue (Similarity ~ 10-30%)
* L:A vs L:D: Light blue (Similarity ~ 5-20%)
* L:A vs L:E: Light blue (Similarity ~ 5-20%)
* L:B vs L:C: Medium blue (Similarity ~ 40-60%)
* L:B vs L:D: Light blue (Similarity ~ 10-30%)
* L:B vs L:E: Light blue (Similarity ~ 5-20%)
* L:C vs L:D: Light blue (Similarity ~ 10-30%)
* L:C vs L:E: Light blue (Similarity ~ 5-20%)
* L:D vs L:E: Light blue (Similarity ~ 5-20%)
**Heatmap (b): Velocity Similarity**
* **Trend:** A very strong diagonal trend is present, even more pronounced than in heatmap (a). The diagonal line is composed of the darkest blue color, indicating very high velocity similarity between components with the same layer label.
* **Data Points (Approximate):**
* L:A vs L:A: Very dark blue (Similarity ~ 95-100%)
* L:B vs L:B: Very dark blue (Similarity ~ 95-100%)
* L:C vs L:C: Very dark blue (Similarity ~ 95-100%)
* L:D vs L:D: Very dark blue (Similarity ~ 95-100%)
* L:E vs L:E: Very dark blue (Similarity ~ 95-100%)
* All other combinations: Light blue (Similarity ~ 0-10%)
### Key Observations
* **High Self-Similarity:** Both heatmaps demonstrate very high similarity between components within the same layer (e.g., L:A vs L:A). This is most pronounced in the Velocity Similarity heatmap.
* **Low Cross-Layer Similarity:** Similarity decreases significantly as you move away from the diagonal, indicating low similarity between components in different layers.
* **Velocity is More Consistent:** Velocity similarity (heatmap b) appears to be more consistent within layers than position similarity (heatmap a).
### Interpretation
These heatmaps likely represent the correlation of behavior or characteristics between different layers (L:A to L:E) within a network security system.
* **Position Similarity** suggests how often components in different layers are found in similar positions or states. The diagonal indicates that components within the same layer tend to exhibit similar positional behavior. The lower similarity off-diagonal suggests that components in different layers have distinct positional characteristics.
* **Velocity Similarity** suggests how similar the rate of change or activity is between components in different layers. The very strong diagonal indicates that components within the same layer exhibit highly correlated velocity patterns. The near-zero similarity off-diagonal suggests that layers operate at different speeds or have different activity patterns.
The fact that velocity similarity is much stronger than position similarity suggests that the *way* these layers change over time is more consistent within a layer than their absolute positions. This could indicate a hierarchical structure where layers respond to events in a coordinated manner, but operate at different levels of abstraction or granularity.
The data suggests a system where layers are relatively independent in their positioning but synchronized in their dynamic behavior. This could be a design feature for resilience or efficiency. Anomalies would be points significantly deviating from the diagonal, indicating unusual behavior for a given layer combination.