## Heatmap: Position and Velocity Similarity Analysis
### Overview
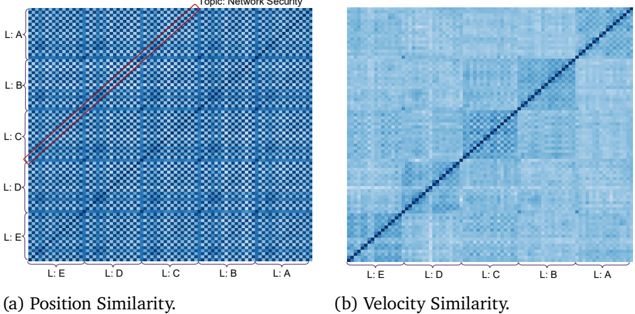
The image contains two side-by-side heatmaps labeled **(a) Position Similarity** and **(b) Velocity Similarity**. Both heatmaps use a grid of labels (L:A to L:E) on both axes, with varying shades of blue to represent similarity scores. A diagonal line is overlaid on each heatmap, and a legend in (a) specifies the topic as "Network Security."
---
### Components/Axes
- **Vertical Axis (Y-axis)**: Labeled from **L:A** (top) to **L:E** (bottom).
- **Horizontal Axis (X-axis)**: Labeled from **L:E** (left) to **L:A** (right).
- **Legend**: Located in the **top-right corner** of heatmap (a), with text:
- **"Topic: Network Security"** (in English).
- **Diagonal Lines**:
- **(a)**: A **red dashed line** spans from **L:D (bottom-left)** to **L:B (top-right)**.
- **(b)**: A **black solid line** spans the full diagonal from **L:E (bottom-left)** to **L:A (top-right)**.
---
### Detailed Analysis
#### (a) Position Similarity
- **Heatmap Pattern**:
- Darker blue squares cluster along the **red dashed line**, indicating higher similarity between labels along this path.
- Lighter blue squares dominate outside this line, suggesting lower similarity.
- **Key Data Points**:
- **L:D ↔ L:B**: Strongest similarity (darkest blue).
- **L:C ↔ L:C**: Perfect self-similarity (darkest blue on the diagonal).
- **L:A ↔ L:A**: Perfect self-similarity (darkest blue on the diagonal).
- **Trend**: The red line highlights a **cluster of high similarity** between L:D, L:C, and L:B, with diminishing similarity as distance from the line increases.
#### (b) Velocity Similarity
- **Heatmap Pattern**:
- Uniformly lighter blue compared to (a), with no distinct clustering.
- The **black diagonal line** suggests a baseline of self-similarity (e.g., L:A ↔ L:A, L:B ↔ L:B).
- **Key Data Points**:
- **L:A ↔ L:A**: Perfect self-similarity (darkest blue on the diagonal).
- **L:E ↔ L:E**: Perfect self-similarity (darkest blue on the diagonal).
- Off-diagonal values are uniformly lighter, indicating low cross-label similarity.
- **Trend**: No significant clusters; similarity decreases monotonically with distance from the diagonal.
---
### Key Observations
1. **Self-Similarity Dominance**: Both heatmaps show perfect similarity along the diagonal (e.g., L:A ↔ L:A), as expected.
2. **Position Similarity Cluster**: The red line in (a) identifies a **group of labels (L:D, L:C, L:B)** with unusually high mutual similarity, suggesting a shared positional characteristic.
3. **Velocity Similarity Uniformity**: The lack of clustering in (b) implies velocity is less correlated between labels compared to position.
4. **Legend Context**: The "Network Security" topic in (a) may indicate that the red line corresponds to a security-related positional pattern.
---
### Interpretation
- **Position Similarity (a)**: The red line likely represents a **critical pathway** in network security, where labels L:D, L:C, and L:B share positional traits (e.g., proximity in a network topology). This could imply these labels are part of a security-critical subsystem.
- **Velocity Similarity (b)**: The uniform similarity suggests velocity is an **independent variable** across labels, with no strong interdependencies.
- **Anomaly**: The red line in (a) deviates from the main diagonal, indicating a **non-trivial relationship** between L:D, L:C, and L:B that warrants further investigation in the context of network security.
---
### Spatial Grounding & Validation
- **Legend Placement**: Top-right corner of (a), ensuring clarity without obscuring data.
- **Color Consistency**:
- Red line in (a) matches the "Network Security" legend.
- Black line in (b) has no legend entry, implying it represents a baseline or default value.
- **Axis Labels**: L:A to L:E are consistently ordered, with no ambiguity in spatial mapping.
---
### Conclusion
The heatmaps reveal that **position similarity** drives clustering in network security contexts, while **velocity similarity** remains uncorrelated. The red line in (a) highlights a critical positional relationship, suggesting L:D, L:C, and L:B are interconnected in security-critical operations. Further analysis of these labels could uncover vulnerabilities or optimization opportunities.