## Pie Chart: Error Breakdown
### Overview
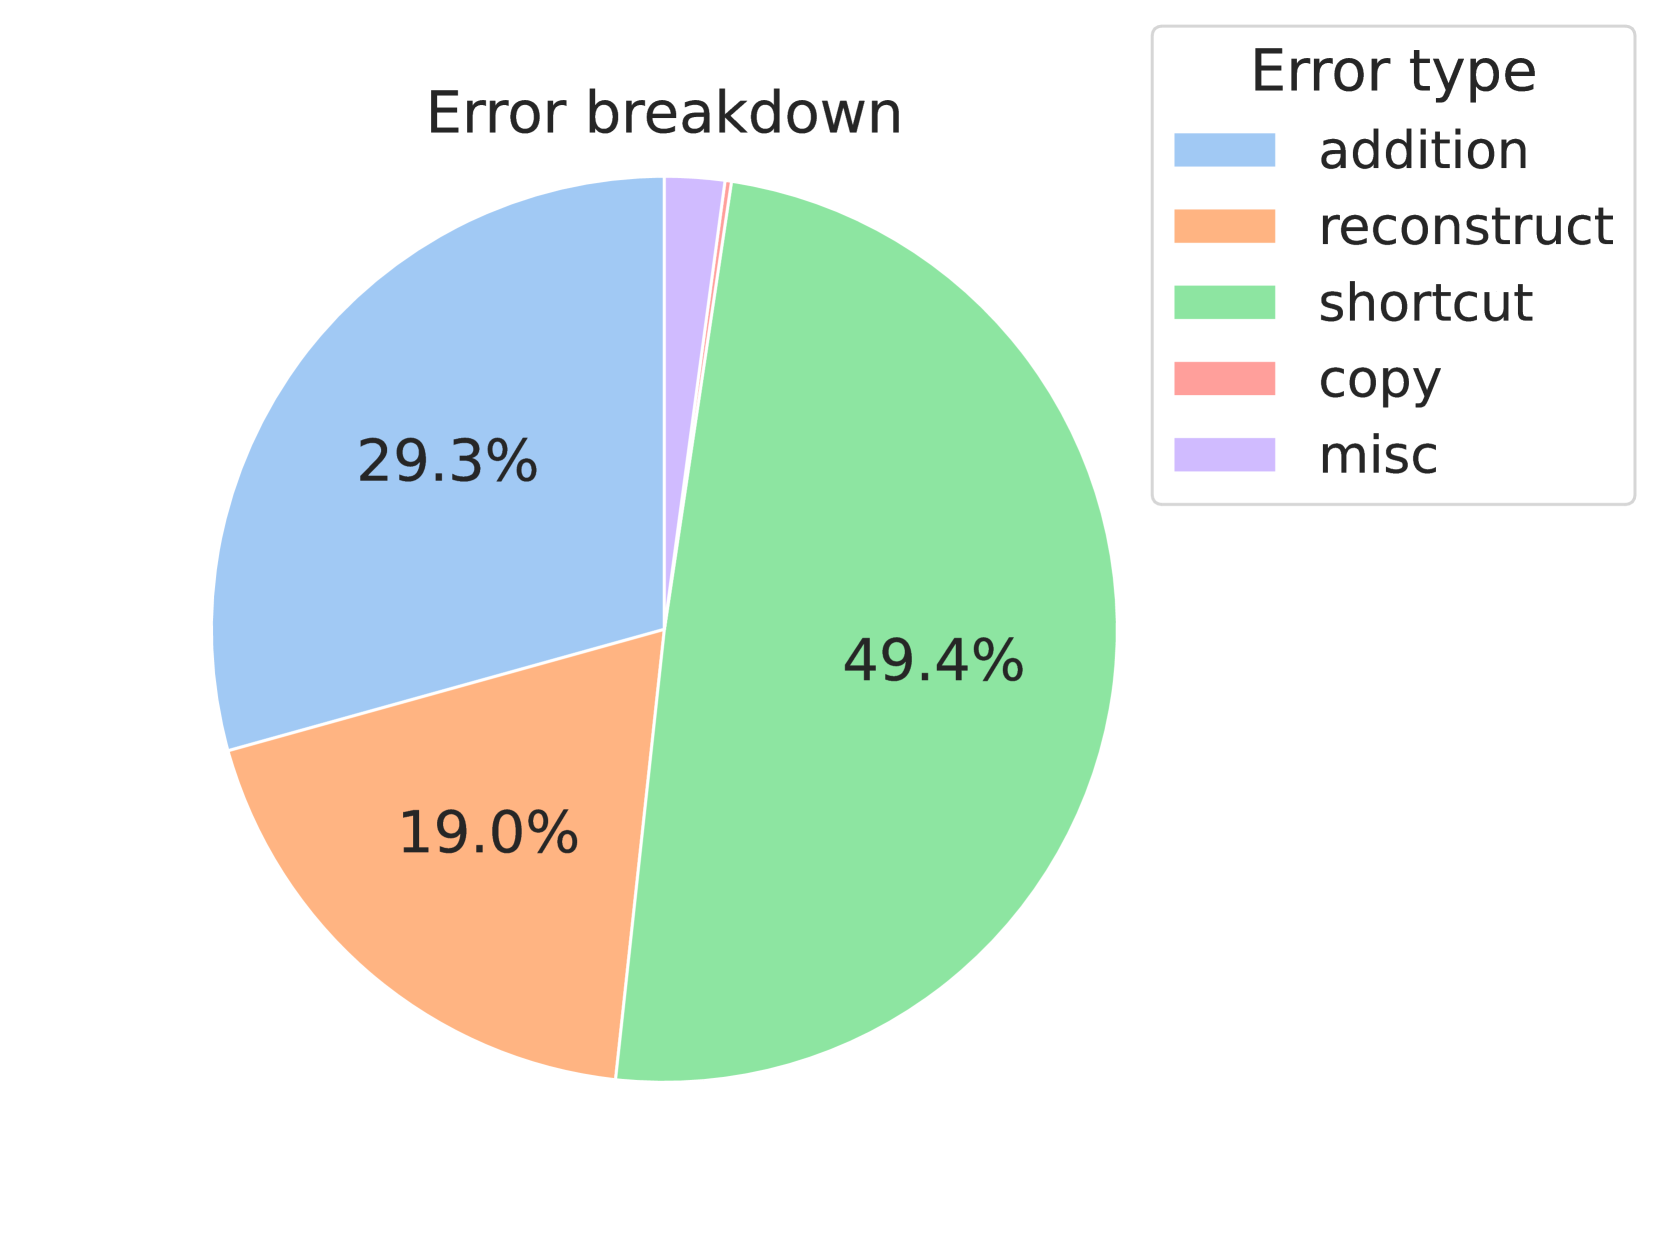
The image displays a pie chart titled "Error breakdown" with a legend categorizing five error types: addition, reconstruct, shortcut, copy, and misc. Each segment is color-coded and labeled with its corresponding percentage. The chart visually represents the distribution of error types, with "shortcut" errors dominating the dataset.
### Components/Axes
- **Legend**: Located in the top-right corner, mapping colors to error types:
- Blue: addition
- Orange: reconstruct
- Green: shortcut
- Red: copy
- Purple: misc
- **Data Segments**: Five proportional slices representing error frequencies, with percentages explicitly labeled.
### Detailed Analysis
1. **Addition (Blue)**: 29.3% of errors, the second-largest segment.
2. **Reconstruct (Orange)**: 19.0% of errors, occupying a moderate portion.
3. **Shortcut (Green)**: 49.4% of errors, the largest segment by far.
4. **Copy (Red)**: 0.3% of errors, a negligible slice.
5. **Misc (Purple)**: 0.1% of errors, the smallest segment.
### Key Observations
- **Dominance of Shortcut Errors**: "Shortcut" errors account for nearly half (49.4%) of all errors, indicating a critical area for improvement.
- **Addition and Reconstruct**: Together, these two error types make up ~48.3% (29.3% + 19.0%), forming the majority outside of "shortcut."
- **Rare Errors**: "Copy" and "misc" errors are virtually insignificant (0.3% and 0.1%, respectively), suggesting they are either well-handled or infrequently triggered.
### Interpretation
The data highlights a systemic issue with "shortcut" errors, which may stem from flawed user interface design, ambiguous shortcut functionality, or user misinterpretation. The high frequency of "addition" and "reconstruct" errors suggests potential problems in data processing or validation workflows. The near-absence of "copy" and "misc" errors implies these features are either robust or underutilized. Addressing "shortcut" errors could significantly reduce overall error rates, while investigating "addition" and "reconstruct" issues may uncover deeper architectural flaws. The chart underscores the need for targeted debugging and user testing to resolve the most impactful error categories.