## Line Graph: Initialization Ablation Study
### Overview
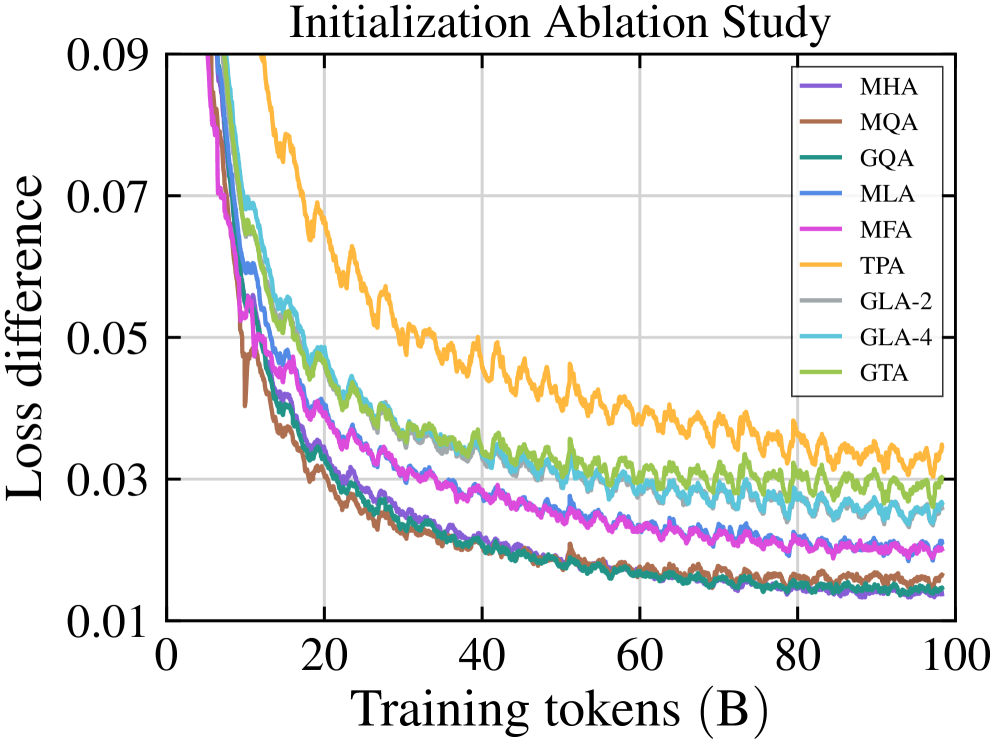
The chart illustrates the relationship between training tokens (in billions) and loss difference across various initialization methods. It shows how different initialization strategies impact model performance during training, with loss difference decreasing as training progresses.
### Components/Axes
- **X-axis**: Training tokens (B) ranging from 0 to 100 (in increments of 20)
- **Y-axis**: Loss difference ranging from 0.01 to 0.09 (in increments of 0.01)
- **Legend**: Located in the top-right corner, mapping colors to initialization methods:
- Purple: MHA
- Brown: MQA
- Teal: GQA
- Blue: MLA
- Pink: MFA
- Orange: TPA
- Gray: GLA-2
- Light Blue: GLA-4
- Green: GTA
### Detailed Analysis
1. **TPA (Orange Line)**:
- Starts at ~0.08 loss difference at 0 tokens
- Shows a steady decline to ~0.03 by 100 tokens
- Maintains the highest loss difference throughout training
2. **MHA (Purple Line)**:
- Begins at ~0.08 loss difference
- Sharp initial drop to ~0.04 by 20 tokens
- Gradual decline to ~0.02 by 100 tokens
3. **MQA (Brown Line)**:
- Starts at ~0.07 loss difference
- Rapid decline to ~0.03 by 40 tokens
- Flattens near ~0.02 by 100 tokens
4. **GQA (Teal Line)**:
- Initial loss ~0.07
- Steady decline to ~0.025 by 100 tokens
5. **MLA (Blue Line)**:
- Begins at ~0.065 loss difference
- Gradual decrease to ~0.02 by 100 tokens
6. **MFA (Pink Line)**:
- Starts at ~0.06 loss difference
- Slow decline to ~0.02 by 100 tokens
7. **GLA-2 (Gray Line)**:
- Initial loss ~0.055
- Moderate decline to ~0.02 by 100 tokens
8. **GLA-4 (Light Blue Line)**:
- Begins at ~0.05 loss difference
- Gradual decrease to ~0.02 by 100 tokens
9. **GTA (Green Line)**:
- Starts at ~0.045 loss difference
- Slowest decline to ~0.02 by 100 tokens
### Key Observations
- All methods show decreasing loss difference with increased training tokens
- TPA consistently maintains the highest loss difference across all training stages
- GTA demonstrates the slowest rate of loss reduction
- Methods with "GLA" in their name (GLA-2, GLA-4) show intermediate performance
- Convergence of lines toward the end suggests diminishing returns after ~80 tokens
### Interpretation
The data demonstrates that initialization methods significantly impact early training performance, with TPA showing the poorest initial efficiency. However, all methods converge toward similar performance levels after sufficient training (>80 tokens), indicating that initialization differences become less critical as training progresses. The varying rates of loss reduction suggest trade-offs between initialization efficiency and final model performance. TPA's persistent higher loss difference might indicate architectural limitations or suboptimal hyperparameters requiring further investigation.