## Line Charts: Generalization Ratio vs Model Size and Train Recurrence
### Overview
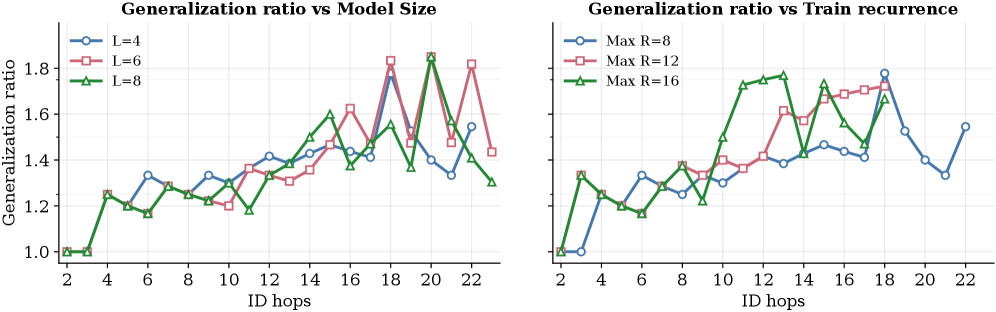
The image contains two line charts comparing the **generalization ratio** (y-axis) across varying **ID hops** (x-axis). The left chart examines the relationship between generalization ratio and **model size** (L=4, L=6, L=8), while the right chart analyzes generalization ratio against **train recurrence** (Max R=8, Max R=12, Max R=16). Both charts show fluctuating trends with peaks and troughs across ID hops.
---
### Components/Axes
#### Left Chart: Generalization Ratio vs Model Size
- **X-axis**: ID hops (2 to 22, increments of 2).
- **Y-axis**: Generalization ratio (1.0 to 1.8, increments of 0.2).
- **Legend**:
- Blue circles: L=4
- Red squares: L=6
- Green triangles: L=8
- **Placement**: Legend is positioned on the right side of the chart.
#### Right Chart: Generalization Ratio vs Train Recurrence
- **X-axis**: ID hops (2 to 22, increments of 2).
- **Y-axis**: Generalization ratio (1.0 to 1.8, increments of 0.2).
- **Legend**:
- Blue circles: Max R=8
- Red squares: Max R=12
- Green triangles: Max R=16
- **Placement**: Legend is positioned on the right side of the chart.
---
### Detailed Analysis
#### Left Chart: Generalization Ratio vs Model Size
1. **L=4 (Blue Circles)**:
- Starts at ~1.0 (ID hop 2), rises to ~1.3 at ID hop 6, peaks at ~1.5 at ID hop 14, then declines to ~1.2 at ID hop 22.
- Shows moderate fluctuations with a single prominent peak.
2. **L=6 (Red Squares)**:
- Starts at ~1.0 (ID hop 2), rises to ~1.4 at ID hop 10, peaks at ~1.7 at ID hop 18, then drops to ~1.3 at ID hop 22.
- Exhibits sharper fluctuations and a higher peak than L=4.
3. **L=8 (Green Triangles)**:
- Starts at ~1.0 (ID hop 2), rises to ~1.5 at ID hop 12, peaks at ~1.8 at ID hop 20, then declines to ~1.3 at ID hop 22.
- Highest peak among all lines, with significant volatility.
#### Right Chart: Generalization Ratio vs Train Recurrence
1. **Max R=8 (Blue Circles)**:
- Starts at ~1.0 (ID hop 2), rises to ~1.3 at ID hop 6, peaks at ~1.7 at ID hop 18, then drops to ~1.4 at ID hop 22.
- Moderate fluctuations with a late-stage peak.
2. **Max R=12 (Red Squares)**:
- Starts at ~1.0 (ID hop 2), rises to ~1.4 at ID hop 10, peaks at ~1.6 at ID hop 14, then declines to ~1.5 at ID hop 22.
- Smoother trend with a mid-chart peak.
3. **Max R=16 (Green Triangles)**:
- Starts at ~1.0 (ID hop 2), rises to ~1.5 at ID hop 12, peaks at ~1.7 at ID hop 16, then fluctuates between ~1.5 and ~1.6.
- Highest peak and sustained high values compared to other lines.
---
### Key Observations
1. **Model Size (L)**:
- Larger models (L=8) achieve higher generalization ratios but show greater volatility.
- Peaks occur at different ID hops (e.g., L=8 peaks at ID hop 20).
2. **Train Recurrence (Max R)**:
- Higher recurrence (Max R=16) correlates with higher generalization ratios.
- Max R=16 maintains elevated values after ID hop 16, suggesting stability.
3. **Cross-Chart Trends**:
- Both charts show generalization ratios plateauing or declining after initial growth, indicating potential overfitting or diminishing returns.
- Peaks in the left chart (model size) align with mid-to-late ID hops, while the right chart (train recurrence) peaks earlier (ID hop 16–18).
---
### Interpretation
1. **Model Size vs. Performance**:
- Increasing model size (L) improves generalization up to a point, but excessive complexity (L=8) introduces instability, as seen in the sharp fluctuations.
- The peak at ID hop 20 for L=8 suggests optimal performance at later stages of training, but the subsequent drop may indicate overfitting.
2. **Train Recurrence vs. Performance**:
- Higher recurrence (Max R=16) achieves better generalization, with sustained high values. This implies that more training steps (Max R) stabilize the model’s ability to generalize.
- The earlier peak for Max R=12 (ID hop 14) suggests a balance between training duration and performance.
3. **General Trends**:
- All lines start at the baseline (generalization ratio = 1.0) and show initial improvement, but none maintain peak performance indefinitely.
- The divergence in trends between model size and train recurrence highlights the trade-off between architectural complexity and training intensity.
---
### Notable Anomalies
- **L=8 (Green Triangles)**: The sharp drop from ~1.8 at ID hop 20 to ~1.3 at ID hop 22 is unusual, potentially indicating overfitting or a data artifact.
- **Max R=8 (Blue Circles)**: The late-stage peak at ID hop 18 contrasts with earlier lines, suggesting that longer training (Max R=8) may require more ID hops to stabilize.
---
### Conclusion
The charts demonstrate that both model size (L) and train recurrence (Max R) influence generalization performance, but with trade-offs. Larger models and higher recurrence improve generalization up to a point, after which performance may degrade. The data underscores the importance of balancing model complexity and training duration to avoid overfitting while maximizing generalization.