## Generalization ratio vs Model Size
### Overview
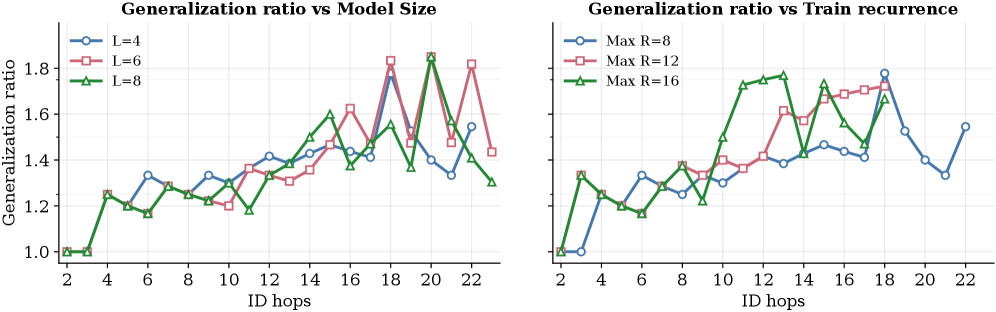
The image displays two line graphs comparing the generalization ratio against model size for different values of L (1, 4, 6, 8) and Max R (8, 12, 16). The x-axis represents the number of ID hops, while the y-axis represents the generalization ratio.
### Components/Axes
- **X-axis**: ID hops, ranging from 2 to 22.
- **Y-axis**: Generalization ratio, ranging from 1.0 to 1.8.
- **Legend**:
- Blue line with circles: L=4
- Red line with squares: L=6
- Green line with triangles: L=8
- Blue line with triangles: Max R=8
- Red line with squares: Max R=12
- Green line with triangles: Max R=16
### Detailed Analysis
- **L=4**: The generalization ratio increases with model size, peaking at Max R=16.
- **L=6**: The generalization ratio shows a similar trend to L=4 but with slightly lower peaks.
- **L=8**: The generalization ratio is consistently higher than L=4 and L=6 across all model sizes.
- **Max R=8**: The generalization ratio increases with model size, peaking at L=8.
- **Max R=12**: The generalization ratio shows a similar trend to Max R=8 but with slightly lower peaks.
- **Max R=16**: The generalization ratio is consistently higher than Max R=8 and Max R=12 across all model sizes.
### Key Observations
- The generalization ratio increases with model size for all values of L and Max R.
- The highest generalization ratio is observed at Max R=16 for all values of L.
- There is a slight decrease in generalization ratio at Max R=12 compared to Max R=16.
### Interpretation
The data suggests that larger models tend to have higher generalization ratios, indicating better performance in terms of generalization. The peak at Max R=16 suggests that this is the optimal model size for the given parameters. The slight decrease at Max R=12 could be due to overfitting or other factors that affect model performance.