## Diagram: Transformer Layer Architecture with MLP and Distribution Redistribution
### Overview
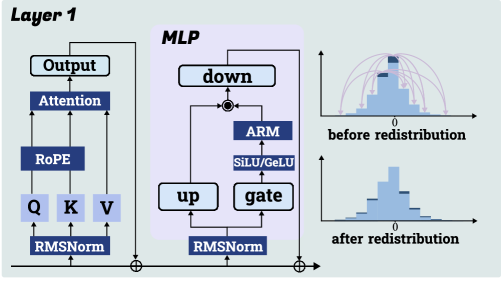
The diagram illustrates a technical architecture of a neural network layer (Layer 1) combined with an MLP (Multi-Layer Perceptron) and visualizations of data distribution changes. Key components include attention mechanisms, positional encoding, normalization layers, and activation functions. Two histograms compare distributions before and after redistribution.
---
### Components/Axes
#### Layer 1
- **Components (left to right flow):**
- **Q, K, V**: Input tensors (Query, Key, Value) processed through RMSNorm.
- **RoPE**: Rotary Positional Encoding applied to Q/K/V.
- **Attention**: Output of RoPE combined with Q/K/V.
- **Output**: Final output of the attention mechanism.
#### MLP (Central Block)
- **Components (bidirectional flow):**
- **down**: Linear projection to lower dimension.
- **ARM**: Approximate Message Passing (ARM) block.
- **SiLU/GeLU**: Activation function (Swish/GELU).
- **gate**: Gating mechanism.
- **up**: Linear projection to higher dimension.
- **RMSNorm**: Root Mean Square Normalization applied after up.
#### Histograms (Right Side)
- **X-axis**: Value distribution (labeled "0" at center).
- **Y-axis**: Count (unlabeled but visually proportional to bar height).
- **Legend**: No explicit legend, but colors differentiate distributions:
- **Before redistribution**: Taller peak at 0 (narrow distribution).
- **After redistribution**: Flatter, wider distribution.
---
### Detailed Analysis
#### Layer 1
- **Flow**: Q/K/V → RMSNorm → RoPE → Attention → Output.
- **Key Elements**:
- **RMSNorm**: Applied to Q/K/V inputs and MLP outputs.
- **RoPE**: Positional encoding integrated into attention mechanism.
#### MLP
- **Flow**:
- `down` → `ARM` → `SiLU/GeLU` → `gate` → `up` → `RMSNorm`.
- Feedback loop from `ARM` to `SiLU/GeLU` (recurrent structure?).
- **Key Elements**:
- **ARM**: Likely a sparse or efficient attention variant.
- **SiLU/GeLU**: Non-linear activation for MLP.
#### Histograms
- **Before Redistribution**:
- Peak at 0 (narrow distribution, high concentration of values near 0).
- Visualized as a tall, narrow histogram.
- **After Redistribution**:
- Flatter distribution with reduced peak at 0.
- Values spread across a wider range (e.g., -1 to +1).
- Arrows indicate redistribution from the peak to other bins.
---
### Key Observations
1. **Redistribution Effect**: The histograms show a clear transformation from a concentrated distribution to a dispersed one, suggesting normalization or regularization in the MLP.
2. **Component Redundancy**: RMSNorm appears in both Layer 1 and MLP, indicating its critical role in stabilizing training.
3. **Bidirectional Flow in MLP**: The `ARM` block feeds back into the activation function, implying a recurrent or iterative process within the MLP.
---
### Interpretation
- **Technical Implications**:
- The architecture combines standard transformer components (attention, RoPE) with an MLP featuring ARM and gating, suggesting a hybrid model for efficiency or specialized tasks.
- The redistribution histograms highlight the impact of normalization (RMSNorm) and activation functions (SiLU/GeLU) on data distribution, critical for preventing gradient issues.
- **Design Choices**:
- Use of ARM in the MLP may aim to reduce computational complexity while maintaining performance.
- The gating mechanism (`gate`) likely controls information flow between MLP subcomponents.
- **Anomalies**:
- The histograms lack explicit numerical labels, making precise value extraction impossible. Approximate trends (narrow → wide) are inferred visually.
- The bidirectional flow in the MLP is atypical for standard MLPs, suggesting a custom design for specific use cases (e.g., autoregressive modeling).
---
### Final Notes
- **Language**: All text is in English.
- **Missing Data**: No numerical values or explicit legends for histograms; trends are qualitative.
- **Spatial Grounding**:
- Histograms are positioned to the right of the architecture, with "before" above "after."
- Component labels are aligned vertically for clarity.