## Line Chart: k-shot regression, k=10
### Overview
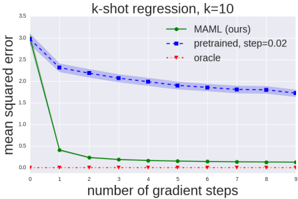
This line chart visualizes the performance of three different methods (MAML, pretrained, and oracle) in a k-shot regression task with k=10. The chart plots the mean squared error against the number of gradient steps. The chart shows how the error decreases as the number of gradient steps increases for each method.
### Components/Axes
* **Title:** k-shot regression, k=10 (top-center)
* **X-axis:** number of gradient steps (bottom-center). Scale ranges from 0 to 9, with tick marks at each integer value.
* **Y-axis:** mean squared error (left-center). Scale ranges from 0 to 3.5, with tick marks at 0, 0.5, 1.0, 1.5, 2.0, 2.5, 3.0, and 3.5.
* **Legend:** Located in the top-right corner.
* MAML (ours) - Green line with diamond markers.
* pretrained, step=0.02 - Blue line with square markers.
* oracle - Red dotted line with circle markers.
### Detailed Analysis
* **MAML (ours):** The green line starts at approximately 3.1 mean squared error at 0 gradient steps and rapidly decreases to approximately 0.05 at 1 gradient step. It continues to decrease, but at a slower rate, reaching approximately 0.02 at 9 gradient steps.
* **pretrained, step=0.02:** The blue line begins at approximately 2.8 mean squared error at 0 gradient steps. It decreases steadily, but more slowly than MAML, to approximately 1.7 mean squared error at 9 gradient steps. A shaded region around the blue line indicates a confidence interval or standard deviation.
* **oracle:** The red dotted line remains consistently close to 0 mean squared error across all gradient steps, fluctuating between approximately 0.01 and 0.03.
Specific Data Points (approximate):
| Gradient Steps | MAML (ours) | pretrained, step=0.02 | oracle |
|---|---|---|---|
| 0 | 3.1 | 2.8 | 0.02 |
| 1 | 0.05 | 2.4 | 0.01 |
| 2 | 0.03 | 2.1 | 0.02 |
| 3 | 0.025 | 1.9 | 0.015 |
| 4 | 0.023 | 1.8 | 0.02 |
| 5 | 0.022 | 1.75 | 0.015 |
| 6 | 0.021 | 1.72 | 0.02 |
| 7 | 0.021 | 1.7 | 0.015 |
| 8 | 0.02 | 1.68 | 0.02 |
| 9 | 0.02 | 1.7 | 0.015 |
### Key Observations
* MAML (ours) significantly outperforms the pretrained method in terms of mean squared error, especially in the initial gradient steps.
* The oracle method achieves near-zero error consistently, representing an ideal performance baseline.
* The pretrained method shows a gradual decrease in error, but it does not converge to the same low error levels as MAML.
* The confidence interval around the pretrained method suggests some variability in its performance.
### Interpretation
The chart demonstrates the effectiveness of the MAML (Model-Agnostic Meta-Learning) approach for k-shot regression. MAML rapidly adapts to new tasks with a small number of gradient steps, achieving a much lower mean squared error compared to a pretrained model. The oracle method represents the theoretical lower bound on the error, indicating the potential for further improvement. The rapid convergence of MAML suggests that it is able to efficiently learn from limited data, making it well-suited for few-shot learning scenarios. The shaded region around the pretrained line indicates that the performance of the pretrained model is less consistent than MAML or the oracle. This could be due to factors such as the initialization of the pretrained model or the choice of learning rate. The chart highlights the benefits of meta-learning for rapid adaptation and improved performance in low-data regimes.