## Line Graph: k-shot regression, k=10
### Overview
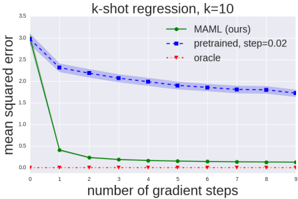
The graph depicts the mean squared error (MSE) of a regression model as a function of the number of gradient steps. The model is trained with a step size of 0.02 and compared to an oracle model.
### Components/Axes
- **X-axis**: Number of gradient steps (ranging from 0 to 9)
- **Y-axis**: Mean squared error (ranging from 0 to 3.5)
- **Legend**:
- Green line: MAML (ours)
- Blue line: Pretrained, step=0.02
- Red line: Oracle
### Detailed Analysis or ### Content Details
The graph shows that the MSE decreases significantly as the number of gradient steps increases for the MAML model. The MSE for the pretrained model is consistently lower than that of the MAML model across all gradient steps. The oracle model has the lowest MSE throughout the range of gradient steps.
### Key Observations
- The MAML model shows a sharp decrease in MSE after the first few gradient steps.
- The pretrained model maintains a lower MSE compared to the MAML model.
- The oracle model has the lowest MSE and remains relatively stable across the gradient steps.
### Interpretation
The data suggests that the MAML model is more effective in minimizing the mean squared error as the number of gradient steps increases. The pretrained model, while still performing well, does not match the performance of the MAML model. The oracle model, which is presumably the ideal model, provides the lowest MSE, indicating the best performance in this regression task. The sharp decrease in MSE for the MAML model suggests that it is learning effectively from the data, while the pretrained model is already performing well but may not be as efficient as the MAML model. The oracle model's stability indicates that it is well-calibrated and reliable.