## Model Diagram: Speech Data Processing
### Overview
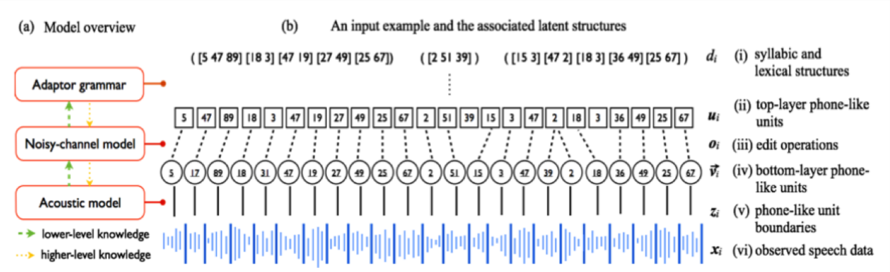
The image presents a diagram illustrating a model for processing speech data. It shows the flow of information through different layers, from observed speech data to syllabic and lexical structures. The diagram is divided into two parts: (a) Model overview, which shows the interaction between Adaptor grammar, Noisy-channel model, and Acoustic model; and (b) An input example and the associated latent structures, which details the transformation of speech data through different layers of abstraction.
### Components/Axes
**Part (a): Model Overview**
* **Models (Left Column):**
* Adaptor grammar (top, red box)
* Noisy-channel model (middle, red box)
* Acoustic model (bottom, red box)
* **Knowledge Flow (Left Bottom):**
* Green dashed arrow: lower-level knowledge
* Yellow dashed arrow: higher-level knowledge
**Part (b): Input Example and Latent Structures**
* **Layers (Right Column):**
* *d<sub>i</sub>*: (i) syllabic and lexical structures
* *u<sub>i</sub>*: (ii) top-layer phone-like units
* *o<sub>i</sub>*: (iii) edit operations
* *v<sub>i</sub>*: (iv) bottom-layer phone-like units
* *z<sub>i</sub>*: (v) phone-like unit boundaries
* *x<sub>i</sub>*: (vi) observed speech data
### Detailed Analysis
**Part (a): Model Overview**
* The Adaptor grammar is at the top, the Noisy-channel model is in the middle, and the Acoustic model is at the bottom.
* The green dashed arrow indicates the flow of lower-level knowledge from the Acoustic model to the Noisy-channel model and from the Noisy-channel model to the Adaptor grammar.
* The yellow dashed arrow indicates the flow of higher-level knowledge from the Adaptor grammar to the Noisy-channel model and from the Noisy-channel model to the Acoustic model.
**Part (b): Input Example and Latent Structures**
* **Syllabic and Lexical Structures (d<sub>i</sub>):**
* ([5 47 89] [18 3] [47 19] [27 49] [25 67])
* ([2 51 39])
* ([15 3] [47 2] [18 3] [36 49] [25 67])
* **Top-Layer Phone-Like Units (u<sub>i</sub>):**
* Sequence of numbers in squares: 5, 47, 89, 18, 3, 47, 19, 27, 49, 25, 67, 2, 51, 39, 15, 3, 47, 2, 18, 3, 36, 49, 25, 67
* **Edit Operations (o<sub>i</sub>):**
* Not explicitly shown, but implied to be the connections between the top and bottom layers of phone-like units.
* **Bottom-Layer Phone-Like Units (v<sub>i</sub>):**
* Sequence of numbers in circles: 5, 17, 89, 18, 31, 47, 19, 27, 49, 25, 67, 2, 51, 15, 3, 47, 39, 2, 18, 3, 36, 49, 25, 67
* **Phone-Like Unit Boundaries (z<sub>i</sub>):**
* Vertical lines indicating boundaries between phone-like units.
* **Observed Speech Data (x<sub>i</sub>):**
* A waveform representation of the speech data.
### Key Observations
* The model uses a hierarchical approach, starting from the observed speech data and progressively abstracting to higher-level linguistic structures.
* The numbers in the squares and circles likely represent encoded phonetic or phonological features.
* The dashed lines connecting the top and bottom layers of phone-like units suggest a mapping or transformation process, possibly involving edit operations.
### Interpretation
The diagram illustrates a speech recognition or processing model that leverages both acoustic information and higher-level linguistic knowledge. The Acoustic model likely extracts features from the raw speech data, which are then refined by the Noisy-channel model using contextual information. The Adaptor grammar provides constraints and rules to generate the final syllabic and lexical structures. The flow of information between these models allows for a more robust and accurate speech processing system. The latent structures show how the model transforms the raw speech data into a sequence of phone-like units and ultimately into higher-level linguistic representations.