## Diagram: Speech Processing Model Architecture and Latent Structure Example
### Overview
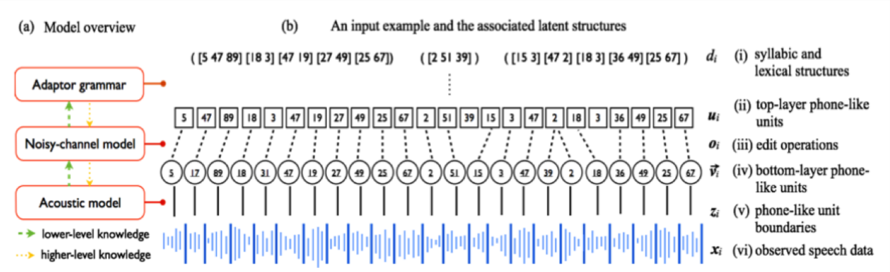
The image is a technical diagram illustrating a hierarchical speech processing model and an example of its internal latent structures when processing an input. It is divided into two main panels: (a) a model overview flowchart and (b) a detailed breakdown of an input example's associated data representations at different layers.
### Components/Axes
**Panel (a) - Model Overview (Left Side):**
* **Three main model components** are shown in red-bordered boxes, arranged vertically:
1. **Adaptor grammar** (Top)
2. **Noisy-channel model** (Middle)
3. **Acoustic model** (Bottom)
* **Knowledge Flow Arrows:**
* **Green dashed arrows** labeled "lower-level knowledge" point upwards (from Acoustic model to Noisy-channel model, and from Noisy-channel model to Adaptor grammar).
* **Orange dotted arrows** labeled "higher-level knowledge" point downwards (from Adaptor grammar to Noisy-channel model, and from Noisy-channel model to Acoustic model).
* **Legend:** Located at the bottom-left of panel (a), defining the arrow types.
**Panel (b) - Input Example and Latent Structures (Right Side):**
This panel displays a sequence of data representations, aligned vertically. Each row is labeled with a Roman numeral and a description.
* **Row (i):** Label: `(i) syllabic and lexical structures`. Content: `d_i`. Shows sequences of numbers in brackets: `([5 47 89] [18 3] [47 19] [27 49] [25 67])`, `([2 51 39])`, `([15 3] [47 2] [18 3] [36 49] [25 67])`.
* **Row (ii):** Label: `(ii) top-layer phone-like units`. Content: `u_i`. Shows a sequence of individual numbers in boxes: `5, 47, 89, 18, 3, 47, 19, 27, 49, 25, 67, 2, 51, 39, 15, 3, 47, 2, 18, 3, 36, 49, 25, 67`.
* **Row (iii):** Label: `(iii) edit operations`. Content: `o_i`. Shows a sequence of symbols in circles: `5, 17, 89, 18, 31, 47, 19, 27, 49, 25, 67, 2, 51, 15, 3, 47, 2, 18, 3, 36, 49, 25, 67`.
* **Row (iv):** Label: `(iv) bottom-layer phone-like units`. Content: `v_i`. Shows a sequence of numbers in circles, connected by lines to the row above: `5, 17, 89, 18, 31, 47, 19, 27, 49, 25, 67, 2, 51, 15, 3, 47, 2, 18, 3, 36, 49, 25, 67`.
* **Row (v):** Label: `(v) phone-like unit boundaries`. Content: `z_i`. Shows a sequence of vertical lines aligned with the units in row (iv).
* **Row (vi):** Label: `(vi) observed speech data`. Content: `x_i`. Shows a blue waveform representing the raw audio signal.
### Detailed Analysis
The diagram maps the transformation of raw speech data (`x_i`) through a hierarchy of abstract representations.
1. **Data Flow (Bottom-Up):** The observed speech waveform (`x_i`) is segmented into phone-like unit boundaries (`z_i`), which correspond to bottom-layer phone-like units (`v_i`). These undergo edit operations (`o_i`) to form top-layer phone-like units (`u_i`), which are finally grouped into syllabic and lexical structures (`d_i`).
2. **Model Interaction (Panel a):** The three models work in concert. The **Acoustic model** likely handles the lowest levels (vi to iv). The **Noisy-channel model** manages the intermediate transformations (iv to ii, involving edit operations). The **Adaptor grammar** operates on the highest structural level (ii to i). The bidirectional arrows indicate that information flows both bottom-up (acoustic evidence) and top-down (linguistic constraints) during processing.
3. **Example Sequence (Panel b):** The specific numerical example shows how a sequence of 24 top-layer units (`u_i`) is derived from 24 bottom-layer units (`v_i`) via edit operations (`o_i`). For instance, the second bottom-layer unit `17` is transformed into the top-layer unit `47`. The top-layer units are then grouped into five structures in `d_i`, with the third structure `([2 51 39])` standing alone.
### Key Observations
* **Hierarchical Abstraction:** The diagram clearly illustrates a multi-layered abstraction from continuous audio to discrete linguistic units.
* **Edit Operations:** The presence of an explicit "edit operations" layer (`o_i`) suggests the model accounts for variability or noise between the hypothesized bottom and top layer units.
* **Structural Grouping:** The highest layer (`d_i`) shows that the linear sequence of phone-like units is parsed into variable-length groupings (e.g., `[5 47 89]`), representing higher-order linguistic constructs like syllables or words.
* **Alignment:** All layers from (i) to (v) are temporally aligned, showing the correspondence between a single observed speech segment and its multiple abstract interpretations.
### Interpretation
This diagram depicts a **generative probabilistic model for speech recognition or analysis**. It posits that observed speech is the result of a process where abstract linguistic structures (syllables/words) are realized as sequences of canonical phone-like units, which are then subject to phonological or acoustic distortions (edit operations) before being manifested as acoustic signals.
The **key insight** is the separation of "bottom-layer" and "top-layer" phone-like units connected by edit operations. This likely models the difference between an idealized phonemic representation and its actual phonetic realization in continuous speech, accounting for phenomena like assimilation, deletion, or insertion. The **Adaptor grammar** at the top suggests the model uses non-parametric Bayesian methods to learn the inventory and patterns of the higher-level structures (like syllable templates or word fragments) directly from data.
The bidirectional knowledge flow is critical: it shows the system is not just a passive bottom-up feature extractor but uses higher-level linguistic knowledge to guide the interpretation of lower-level acoustic cues, which is a hallmark of sophisticated speech processing systems. The entire pipeline, from `x_i` to `d_i`, represents a **hierarchical Bayesian inference** process where the goal is to recover the most probable linguistic structure given the observed audio.