## Scatter Plot Grid: Layer Analysis of Categorical Data
### Overview
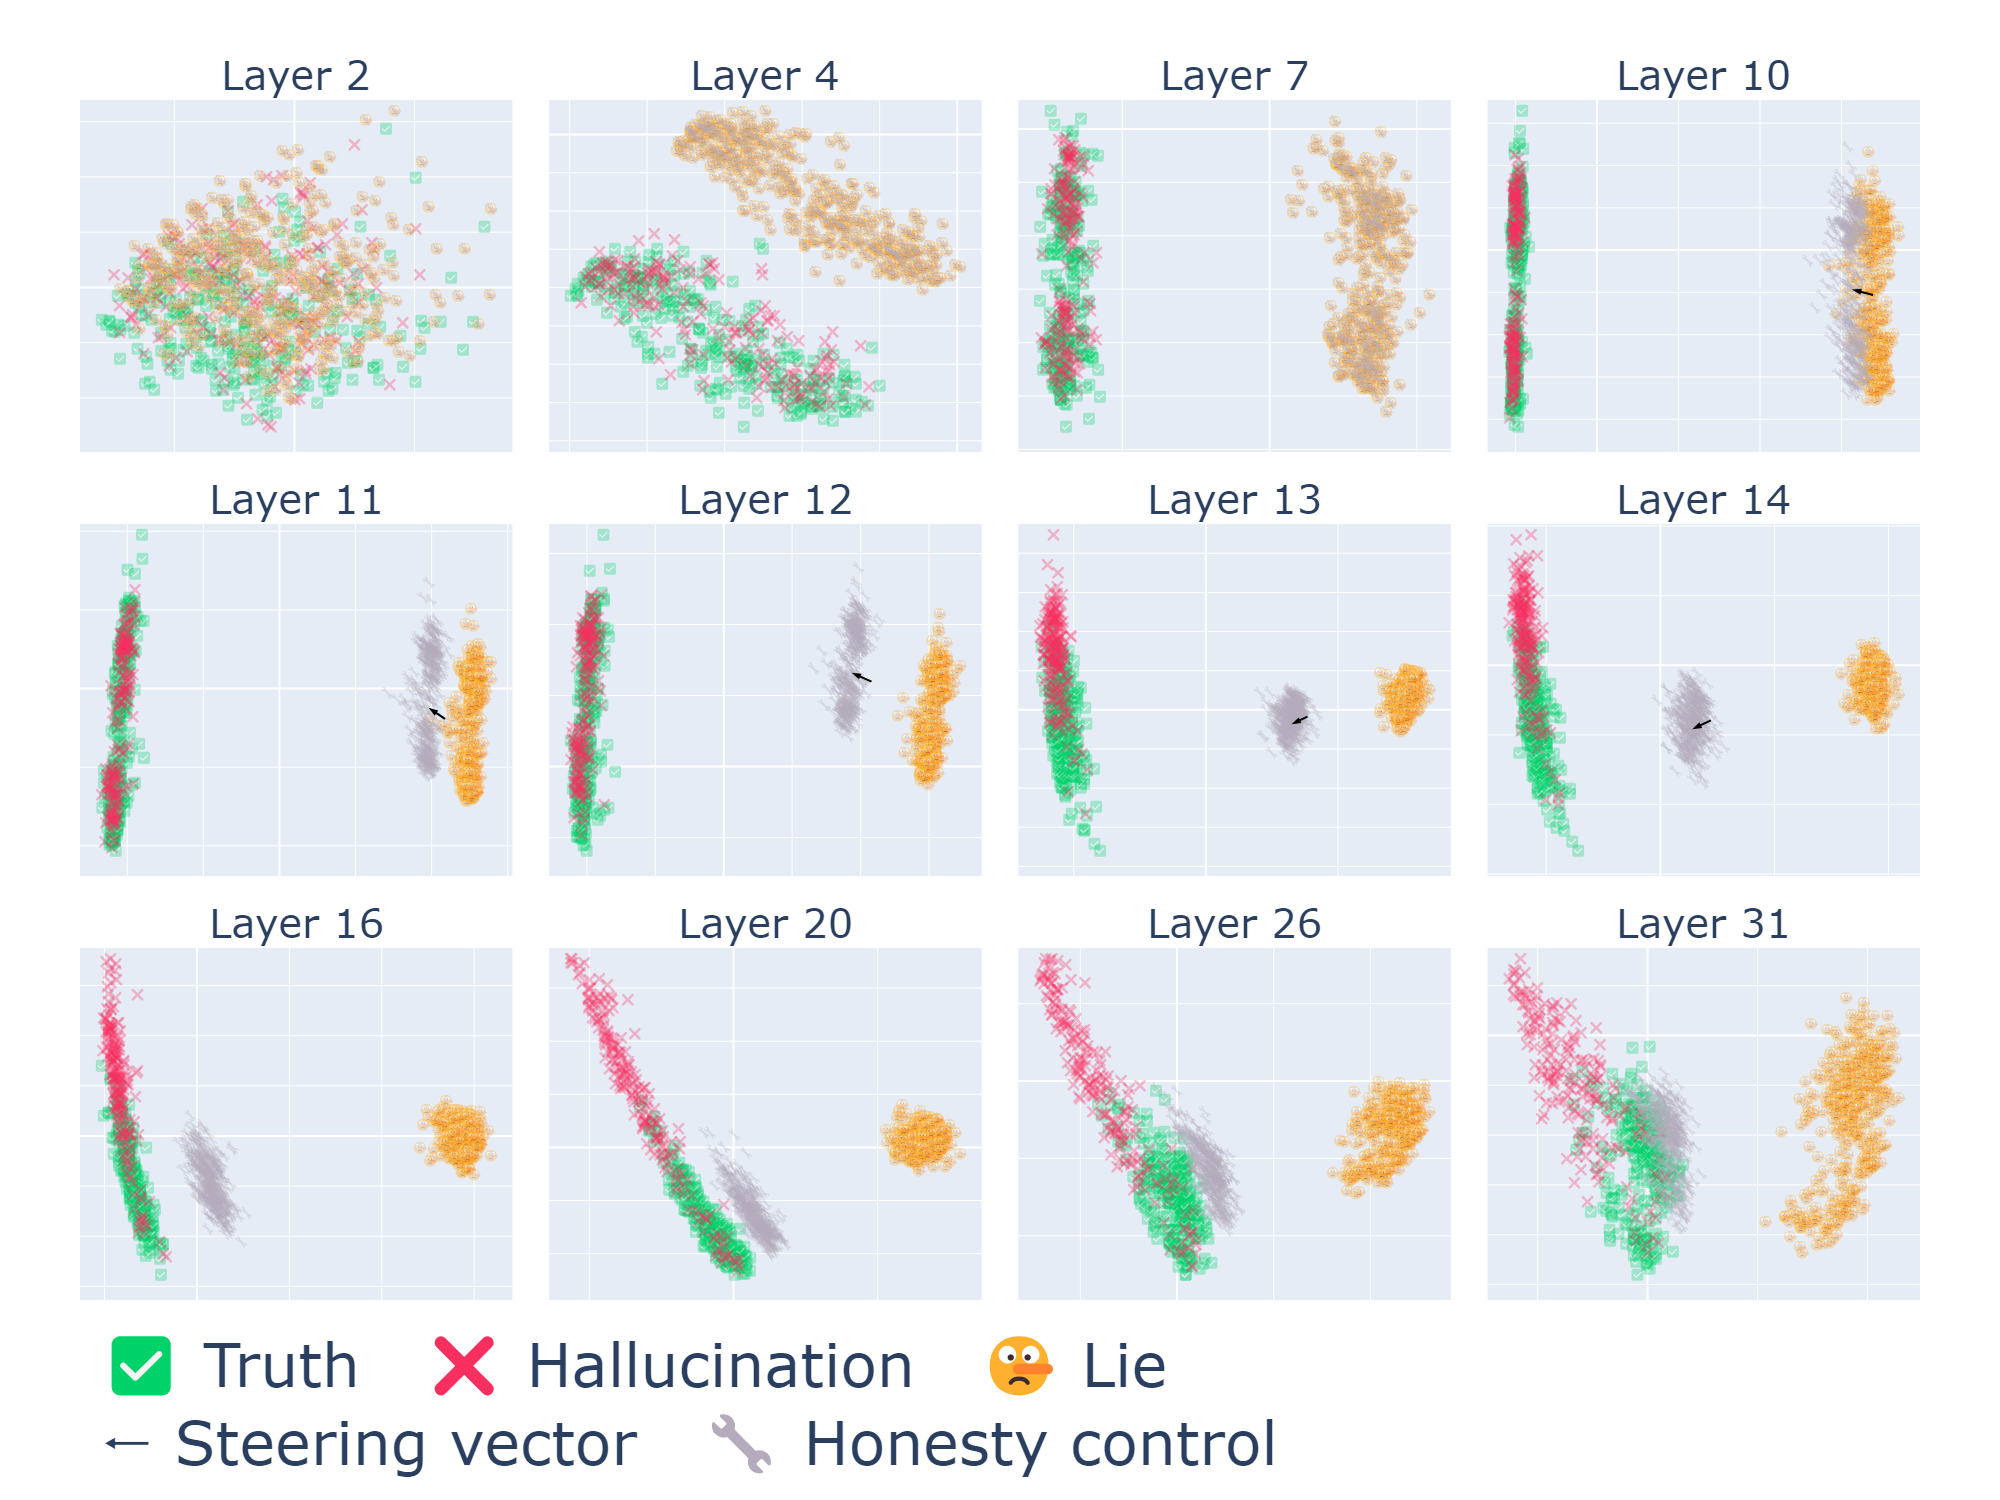
The image displays a 4x3 grid of scatter plots labeled "Layer X" (X = 2, 4, 7, 10, 11, 12, 13, 14, 16, 20, 26, 31). Each plot visualizes the distribution of three categorical data types (Truth, Hallucination, Lie) across two dimensions. The plots use color-coded symbols with a legend at the bottom, and include directional indicators (steering vector and honesty control) in some layers.
### Components/Axes
- **Legend** (bottom-center):
- 🟩 Checkmark: Truth
- 🔴 Cross: Hallucination
- 🤥 Emoji: Lie
- ⬅️ Arrow: Steering vector
- 🔧 Wrench: Honesty control
- **Axes**: Unlabeled numerical axes (X and Y) with gridlines. No explicit scale markers visible.
- **Plot Layout**: Each layer's plot occupies equal grid space. Legend positioned centrally at the bottom of the entire grid.
### Detailed Analysis
1. **Layer 2**:
- Dense overlapping clusters of all three categories.
- Steering vector (⬅️) points leftward; honesty control (🔧) appears near the center.
2. **Layer 4**:
- Truth (🟩) and Hallucination (🔴) form distinct diagonal clusters.
- Lie (🤥) points concentrated in the upper-right quadrant.
3. **Layer 7**:
- Truth and Hallucination form vertical stripes on the left; Lie clusters on the right.
- Steering vector points diagonally downward.
4. **Layer 10**:
- Truth and Hallucination separate into left/right vertical bands.
- Lie points sparse and scattered.
5. **Layer 11-14**:
- Gradual separation of Truth (left) and Hallucination (right) with increasing layer depth.
- Lie points diminish in density.
6. **Layer 16-31**:
- Truth and Hallucination form distinct vertical clusters with minimal overlap.
- Lie points become isolated or absent in higher layers (26, 31).
- Steering vector and honesty control indicators appear only in early layers (2, 4, 7, 10).
### Key Observations
- **Trend Verification**:
- Truth (🟩) consistently occupies the left side of plots across all layers.
- Hallucination (🔴) shifts from overlapping with Truth in early layers to right-aligned clusters in later layers.
- Lie (🤥) density decreases significantly in layers >14, becoming sparse or absent in layers 26 and 31.
- **Spatial Grounding**:
- Legend colors match data points exactly (e.g., green checkmarks = Truth).
- Steering vector (⬅️) and honesty control (🔧) only appear in early layers (2, 4, 7, 10).
### Interpretation
The data suggests a progression in model layer behavior:
1. **Early Layers (2-10)**:
- High overlap between Truth and Hallucination indicates ambiguous representations.
- Presence of steering vector and honesty control implies active correction mechanisms.
2. **Mid-Layers (11-20)**:
- Increasing separation between Truth and Hallucination suggests improved feature discrimination.
- Lie points persist but become less frequent, indicating better factual grounding.
3. **Late Layers (26-31)**:
- Near-complete separation of Truth and Hallucination implies robust categorical boundaries.
- Absence of Lie points may indicate over-correction or model saturation.
Notable anomalies include the sudden disappearance of Lie points in layers 26-31, which could signal either successful lie detection or model collapse. The directional indicators (steering vector/honesty control) in early layers suggest intentional bias correction mechanisms that diminish as the model matures.