## Line Charts: RLM vs Standard Model Performance
### Overview
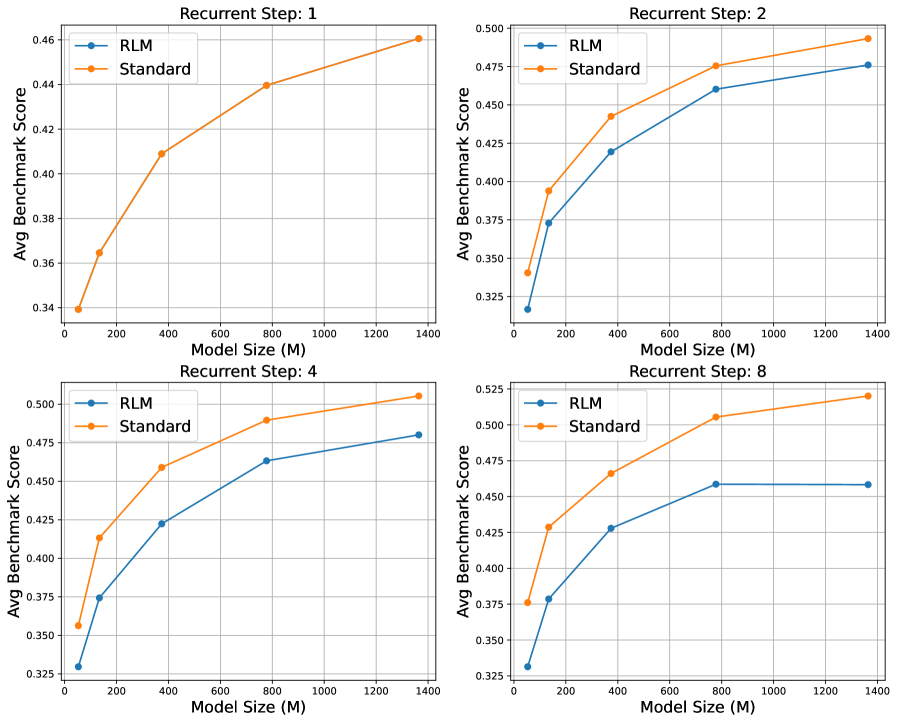
The image contains four line charts comparing the performance of RLM (Recurrent Latent Model) and Standard models across different model sizes and recurrent steps. Each chart represents a different recurrent step (1, 2, 4, and 8), plotting the average benchmark score against the model size in millions (M).
### Components/Axes
* **Title:** Each chart has a title indicating the recurrent step number (e.g., "Recurrent Step: 1").
* **X-axis:** Model Size (M), with markers at 0, 200, 400, 600, 800, 1000, 1200, and 1400.
* **Y-axis:** Avg Benchmark Score, with markers ranging from 0.325 to 0.525, incrementing by 0.025.
* **Legend:** Located in the top-left corner of each chart, indicating:
* Blue line: RLM
* Orange line: Standard
### Detailed Analysis
**Chart 1: Recurrent Step: 1**
* **RLM (Blue):** The line slopes upward, starting at approximately 0.34 at Model Size 0 and reaching approximately 0.46 at Model Size 1400.
* (0, 0.34)
* (100, 0.36)
* (400, 0.41)
* (800, 0.44)
* (1400, 0.46)
* **Standard (Orange):** The line slopes upward, starting at approximately 0.34 at Model Size 0 and reaching approximately 0.46 at Model Size 1400.
* (0, 0.34)
* (100, 0.365)
* (400, 0.41)
* (800, 0.44)
* (1400, 0.46)
**Chart 2: Recurrent Step: 2**
* **RLM (Blue):** The line slopes upward, starting at approximately 0.32 at Model Size 0 and reaching approximately 0.48 at Model Size 1400.
* (0, 0.32)
* (100, 0.37)
* (400, 0.42)
* (800, 0.46)
* (1400, 0.48)
* **Standard (Orange):** The line slopes upward, starting at approximately 0.34 at Model Size 0 and reaching approximately 0.50 at Model Size 1400.
* (0, 0.34)
* (100, 0.39)
* (400, 0.44)
* (800, 0.475)
* (1400, 0.49)
**Chart 3: Recurrent Step: 4**
* **RLM (Blue):** The line slopes upward, starting at approximately 0.33 at Model Size 0 and reaching approximately 0.48 at Model Size 1400.
* (0, 0.33)
* (100, 0.375)
* (400, 0.42)
* (800, 0.46)
* (1400, 0.48)
* **Standard (Orange):** The line slopes upward, starting at approximately 0.36 at Model Size 0 and reaching approximately 0.50 at Model Size 1400.
* (0, 0.36)
* (100, 0.41)
* (400, 0.46)
* (800, 0.49)
* (1400, 0.505)
**Chart 4: Recurrent Step: 8**
* **RLM (Blue):** The line slopes upward, starting at approximately 0.33 at Model Size 0, increases until Model Size 800, then plateaus at approximately 0.46.
* (0, 0.33)
* (100, 0.38)
* (400, 0.43)
* (800, 0.46)
* (1400, 0.46)
* **Standard (Orange):** The line slopes upward, starting at approximately 0.38 at Model Size 0 and reaching approximately 0.52 at Model Size 1400.
* (0, 0.38)
* (100, 0.43)
* (400, 0.47)
* (800, 0.505)
* (1400, 0.52)
### Key Observations
* The Standard model consistently outperforms the RLM model across all recurrent steps and model sizes, except at recurrent step 1 where they are approximately equal.
* The performance gap between the Standard and RLM models widens as the recurrent step increases.
* For the RLM model, increasing the recurrent step beyond 4 does not seem to improve performance significantly, as the line plateaus at recurrent step 8.
* Both models show diminishing returns in performance as the model size increases, particularly at higher recurrent steps.
### Interpretation
The data suggests that the Standard model architecture is more effective than the RLM architecture for this particular task, especially as the number of recurrent steps increases. The plateau in RLM performance at higher recurrent steps indicates a potential limitation in the model's ability to leverage additional recurrence. The diminishing returns observed for both models suggest that increasing model size beyond a certain point may not be beneficial. The recurrent step 1 chart shows that at the beginning, the models are approximately equal, but as the recurrent steps increase, the Standard model pulls ahead. This could mean that the Standard model is better at leveraging the recurrent steps.