## Diagram: Algorithm and System Track Comparison
### Overview
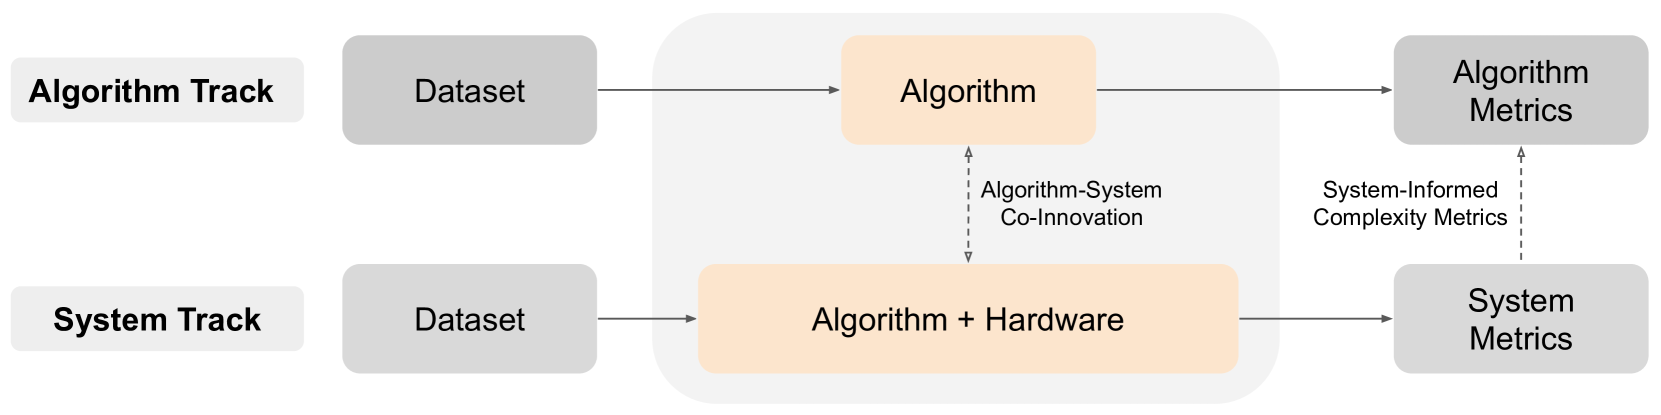
The image is a diagram illustrating two distinct tracks: an "Algorithm Track" and a "System Track." It outlines the flow from dataset to metrics, highlighting the interaction between algorithms, hardware, and system complexity.
### Components/Axes
* **Algorithm Track**: Starts with "Algorithm Track" label, followed by "Dataset", "Algorithm", and "Algorithm Metrics".
* **System Track**: Starts with "System Track" label, followed by "Dataset", "Algorithm + Hardware", and "System Metrics".
* **Arrows**: Solid arrows indicate the primary flow of data and processes. Dashed arrows indicate feedback or influence.
* **Labels**: The labels are contained within rounded rectangles.
* **Central Box**: A larger rounded rectangle encompasses the "Algorithm" and "Algorithm + Hardware" components, suggesting a shared environment or process.
* **Feedback Loops**: Dashed arrows connect "Algorithm + Hardware" to "Algorithm", labeled "Algorithm-System Co-Innovation", and "System Metrics" to "Algorithm Metrics", labeled "System-Informed Complexity Metrics".
### Detailed Analysis
* **Algorithm Track Flow**:
* Begins with a "Dataset" (gray rounded rectangle).
* Flows to an "Algorithm" (light orange rounded rectangle).
* Culminates in "Algorithm Metrics" (gray rounded rectangle).
* **System Track Flow**:
* Begins with a "Dataset" (gray rounded rectangle).
* Flows to "Algorithm + Hardware" (light orange rounded rectangle).
* Culminates in "System Metrics" (gray rounded rectangle).
* **Interactions**:
* "Algorithm-System Co-Innovation": A dashed arrow points from "Algorithm + Hardware" to "Algorithm", indicating a feedback loop.
* "System-Informed Complexity Metrics": A dashed arrow points from "System Metrics" to "Algorithm Metrics", indicating a feedback loop.
### Key Observations
* The diagram emphasizes the parallel nature of the Algorithm and System Tracks.
* The central box highlights the core processing components (Algorithm and Algorithm + Hardware).
* The dashed arrows indicate the iterative and interconnected nature of algorithm and system development.
### Interpretation
The diagram illustrates two distinct approaches to problem-solving: one focused solely on algorithms and the other integrating algorithms with hardware. The feedback loops suggest that system metrics can inform algorithm development, and vice versa, leading to co-innovation. The diagram implies that considering both algorithm and system aspects can lead to more comprehensive and optimized solutions. The "System-Informed Complexity Metrics" suggests that the system track incorporates a deeper understanding of the complexities introduced by hardware and system-level considerations.