# Technical Diagram Analysis
## Diagram Overview
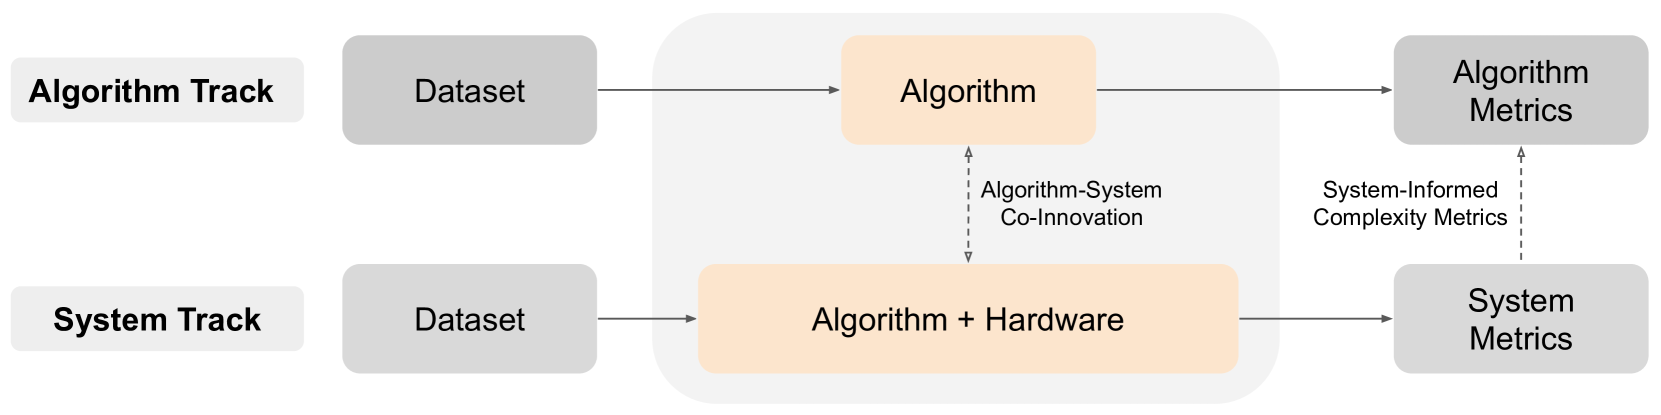
The image depicts a two-track system architecture diagram illustrating the relationship between algorithms, datasets, hardware, and metrics. The diagram uses color-coded boxes and directional arrows to represent data flow and interdependencies.
## Component Breakdown
### Left Side: Input Tracks
1. **Algorithm Track**
- Light gray box labeled "Algorithm Track"
- Connected to a dark gray box labeled "Dataset"
- Arrows flow from Dataset → Algorithm
2. **System Track**
- Light gray box labeled "System Track"
- Connected to a dark gray box labeled "Dataset"
- Arrows flow from Dataset → Algorithm + Hardware
### Central Processing
1. **Algorithm Processing**
- Light orange box labeled "Algorithm"
- Receives input from both Algorithm Track and System Track datasets
- Contains bidirectional relationship with System Track via:
- Dashed arrow labeled "Algorithm-System Co-Innovation"
2. **Hardware-Integrated Processing**
- Light orange box labeled "Algorithm + Hardware"
- Receives input exclusively from System Track dataset
- Contains bidirectional relationship with Algorithm Track via:
- Dashed arrow labeled "System-Informed Complexity Metrics"
### Right Side: Output Metrics
1. **Algorithm Metrics**
- Dark gray box labeled "Algorithm Metrics"
- Receives direct input from Algorithm processing
- Contains bidirectional relationship with System Track via:
- Dashed arrow labeled "System-Informed Complexity Metrics"
2. **System Metrics**
- Dark gray box labeled "System Metrics"
- Receives direct input from Algorithm + Hardware processing
- Contains bidirectional relationship with Algorithm Track via:
- Dashed arrow labeled "System-Informed Complexity Metrics"
## Key Relationships
1. **Co-Innovation Pathway**
- Algorithm → Algorithm-System Co-Innovation → Algorithm + Hardware
- Indicates iterative development between algorithmic and hardware components
2. **Complexity Feedback Loop**
- System Metrics → System-Informed Complexity Metrics → Algorithm Metrics
- Shows how system performance data informs algorithmic complexity analysis
## Color Coding
- **Light Gray**: Track categories (Algorithm/System)
- **Dark Gray**: Dataset containers
- **Light Orange**: Processing components (Algorithm/Algorithm+Hardware)
- **Dashed Arrows**: Represent bidirectional relationships and feedback loops
## Spatial Relationships
- **Vertical Alignment**:
- Algorithm Track (top)
- System Track (bottom)
- **Horizontal Flow**:
- Left-to-right data processing
- Central convergence point for both tracks
- **Bidirectional Connections**:
- Dashed arrows create cross-track relationships
- Positioned between central processing components
## Technical Implications
1. **Integrated Development**
- Simultaneous algorithmic and hardware optimization
- Shared dataset foundation for both tracks
2. **Performance Feedback**
- System metrics directly influence algorithm development
- Complexity metrics bridge hardware and algorithmic performance
3. **Data Flow Efficiency**
- Single dataset source for each track
- Minimized cross-track data dependencies