## Network Diagram: Mobile Station Connections to Base Station
### Overview
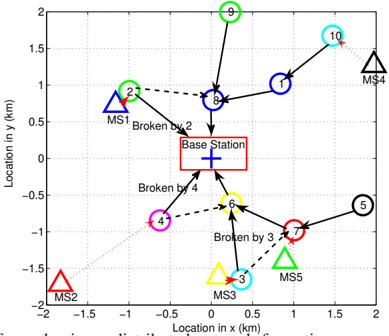
The image is a network diagram illustrating the connections between a base station and several mobile stations (MS). The diagram shows the location of each station in a 2D space, with the x and y axes representing location in kilometers (km). The connections are represented by lines, with some connections being solid and others dashed, indicating different types of links or signal strengths. Arrows indicate the direction of communication.
### Components/Axes
* **X-axis:** Location in x (km), ranging from approximately -2 to 2.
* **Y-axis:** Location in y (km), ranging from approximately -2 to 2.
* **Base Station:** Represented by a red rectangle with a blue cross inside, located near the center of the diagram.
* **Mobile Stations (MS):** Represented by triangles, labeled MS1, MS2, MS3, MS4, and MS5.
* **Numbered Nodes:** Represented by circles with numbers 1 through 10 inside. Each circle has a different color.
* **Connections:** Solid lines with arrowheads indicate direct connections. Dashed lines indicate broken connections.
* **"Broken by" Labels:** Text labels indicating which MS is causing a broken connection.
### Detailed Analysis
* **Base Station Location:** Approximately (0, 0).
* **MS1:** Located at approximately (-1, 0.75), represented by a blue triangle.
* **MS2:** Located at approximately (-1.75, -1.75), represented by a red triangle.
* **MS3:** Located at approximately (0.25, -1.75), represented by a yellow triangle.
* **MS4:** Located at approximately (1.75, 1.5), represented by a black triangle.
* **MS5:** Located at approximately (0.75, -1.25), represented by a green triangle.
**Node Connections and Locations:**
* **Node 1:** Located at approximately (1, 1), connected to Node 8. Color: Blue.
* **Node 2:** Located at approximately (-0.75, 0.75), connected to Node 8 with a dashed line. Color: Green. "Broken by 2" is written near this connection.
* **Node 3:** Located at approximately (0.25, -1.5), connected to Node 6 with a dashed line. Color: Yellow. "Broken by 3" is written near this connection.
* **Node 4:** Located at approximately (-0.5, -0.75), connected to Node 6 with a dashed line. Color: Pink. "Broken by 4" is written near this connection. Also connected to MS2 with a dotted line.
* **Node 5:** Located at approximately (1.5, -0.75), connected to Node 7. Color: Black.
* **Node 6:** Located at approximately (0.25, -0.5), connected to the Base Station. Color: Yellow.
* **Node 7:** Located at approximately (0.75, -1), connected to Node 6. Color: Red.
* **Node 8:** Located at approximately (0, 0.75), connected to the Base Station. Color: Blue.
* **Node 9:** Located at approximately (0.25, 1.75), connected to Node 8. Color: Green.
* **Node 10:** Located at approximately (1.25, 1.5), connected to Node 8. Color: Cyan. Also connected to MS4 with a dotted line.
### Key Observations
* Nodes 6 and 8 are directly connected to the Base Station.
* Nodes 2, 3, and 4 have broken connections to other nodes, indicated by dashed lines and "Broken by" labels.
* MS1, MS2, MS3, MS4, and MS5 are located near nodes 2, 4, 3, 10, and 7 respectively.
* MS2 and MS4 are connected to nodes 4 and 10 respectively with dotted lines.
### Interpretation
The diagram illustrates a network topology where mobile stations communicate through intermediate nodes to reach a base station. The "Broken by" labels suggest interference or obstacles caused by the respective mobile stations, disrupting the direct connections between nodes. The dotted lines may represent a weaker or alternative connection between the MS and the nodes. The diagram could be used to analyze network performance, identify potential bottlenecks, or optimize the placement of mobile stations and nodes to improve connectivity.