## Diagram: Network Topology with Broken Links
### Overview
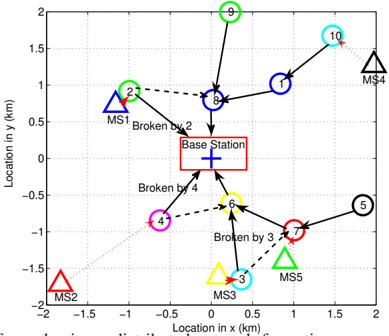
The image depicts a network topology represented on a 2D Cartesian coordinate plane. A central "Base Station" is connected to several "MS" (Mobile Station) nodes via a series of numbered nodes (1-10). Several links between nodes are indicated as "Broken by" a specific number, suggesting a failure point. The diagram illustrates the network's structure and identifies points of failure.
### Components/Axes
* **Axes:**
* X-axis: "Location in x (km)", ranging from approximately -1.5 km to 2 km.
* Y-axis: "Location in y (km)", ranging from approximately -2 km to 1.75 km.
* **Nodes:**
* Base Station: Represented by a blue plus sign (+) at approximately (0 km, 0 km). Labeled "Base Station".
* MS1: Represented by a blue triangle (▲) at approximately (-1 km, 0.75 km). Labeled "MS1".
* MS2: Represented by a red triangle (▼) at approximately (-1.5 km, -1.75 km). Labeled "MS2".
* MS3: Represented by a yellow triangle (▲) at approximately (0.5 km, -1.5 km). Labeled "MS3".
* MS4: Represented by a black triangle (▲) at approximately (1.75 km, 1.25 km). Labeled "MS4".
* MS5: Represented by a green triangle (▲) at approximately (1.25 km, -1.25 km). Labeled "MS5".
* Numbered Nodes: Nodes 1 through 10 are represented by colored circles.
* **Links:** Solid lines represent active connections. Dashed lines represent broken connections.
* **Labels:** "Broken by [number]" indicates the failure point for a broken link.
### Detailed Analysis or Content Details
The network topology can be described as follows:
* **Base Station to MS1:** Connected via nodes 8 and 2. The link between nodes 2 and 8 is broken by 2.
* **Base Station to MS2:** Connected via nodes 4. The link between nodes 4 and the Base Station is broken by 4.
* **Base Station to MS3:** Connected via nodes 6 and 3. The link between nodes 3 and 6 is broken by 3.
* **Base Station to MS4:** Connected via nodes 8, 1, and 10.
* **Base Station to MS5:** Connected via nodes 6 and 7.
* **Node 1 to Node 10:** Active connection.
* **Node 2 to Node 8:** Broken connection, "Broken by 2".
* **Node 3 to Node 6:** Broken connection, "Broken by 3".
* **Node 4 to Base Station:** Broken connection, "Broken by 4".
* **Node 5 to Node 6:** Active connection.
* **Node 7 to Node 6:** Active connection.
* **Node 8 to Node 1:** Active connection.
* **Node 9 to Node 8:** Active connection.
Approximate coordinates of numbered nodes:
* Node 1: (1.25 km, 1.0 km)
* Node 2: (-0.75 km, 0.75 km)
* Node 3: (0.5 km, -1.5 km)
* Node 4: (-0.5 km, -1.0 km)
* Node 5: (1.5 km, -0.5 km)
* Node 6: (0.0 km, -0.5 km)
* Node 7: (0.75 km, -1.0 km)
* Node 8: (0.0 km, 0.75 km)
* Node 9: (0.0 km, 1.5 km)
* Node 10: (1.75 km, 1.5 km)
### Key Observations
* Multiple links are broken, indicating potential network instability.
* MS2 is completely isolated due to the broken link to the Base Station.
* MS1 has a broken link, but still has a path to the Base Station through node 8.
* MS3 is isolated due to the broken link to the Base Station.
* MS4 and MS5 appear to be fully connected to the Base Station.
### Interpretation
The diagram illustrates a network experiencing multiple link failures. The "Broken by" labels suggest a possible systematic cause for the failures, potentially related to a specific component or event. The isolation of MS2 and MS3 highlights the impact of these failures on network connectivity. The diagram could be used to diagnose network problems, prioritize repairs, or evaluate the resilience of the network topology. The coordinate system suggests a physical layout, potentially allowing for analysis of environmental factors contributing to the failures. The diagram is a simplified representation of a complex system, and further information would be needed to fully understand the underlying causes and implications of the observed failures. The use of numbered nodes and "Broken by" labels suggests a troubleshooting or diagnostic process is underway.