## Diagram: Network Node Connections and Base Station Relationships
### Overview
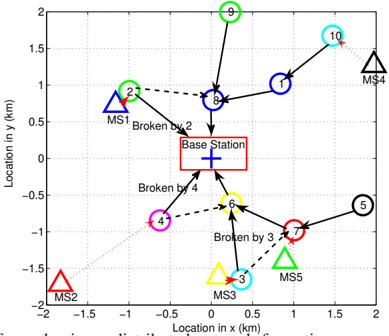
The diagram illustrates a network of five nodes (MS1-MS5) connected to a central base station. Nodes are represented by colored geometric shapes (triangles, circles, etc.) positioned on a 2D coordinate grid. Arrows indicate directional connections between nodes and the base station, with some connections labeled as "Broken by" specific numbers. The base station is marked with a red box containing a plus sign at the origin (0,0).
### Components/Axes
- **Axes**:
- X-axis: "Location in x (km)" ranging from -2 to 2
- Y-axis: "Location in y (km)" ranging from -2 to 2
- **Legend**: Located on the right side of the diagram, associating colors/shapes with node identifiers:
- Blue triangle: MS1
- Red triangle: MS2
- Green circle: MS2 (conflict with legend entry)
- Purple circle: MS4
- Yellow triangle: MS5
- Black triangle: MS4 (conflict with legend entry)
- Blue circle: MS3
- Red circle: MS7
- Green circle: MS9
- Black triangle: MS10
- **Key Elements**:
- Base station: Red box with "+" at (0,0)
- Arrows: Dashed lines with labels like "Broken by 2", "Broken by 3", etc.
- Node positions: Precisely plotted on the grid (e.g., MS1 at (-1.5,1), MS2 at (-2,-1.5))
### Detailed Analysis
1. **Node Positions**:
- MS1: (-1.5, 1) [Blue triangle]
- MS2: (-2, -1.5) [Red triangle]
- MS3: (-0.5, -1) [Blue circle]
- MS4: (0.5, -1) [Purple circle]
- MS5: (1, -0.5) [Yellow triangle]
- MS7: (0.5, 0.5) [Red circle]
- MS9: (0, 1.5) [Green circle]
- MS10: (1.5, 1.5) [Black triangle]
2. **Connection Patterns**:
- Base station connects to all nodes via dashed arrows
- Broken connections:
- MS1 → Base station: "Broken by 2"
- MS4 → Base station: "Broken by 4"
- MS3 → Base station: "Broken by 3"
- Intact connections:
- MS2 → MS1 (dashed arrow)
- MS5 → MS7 (dashed arrow)
- MS9 → MS10 (dashed arrow)
3. **Spatial Relationships**:
- Nodes MS1 and MS2 are in the northwest quadrant
- MS3 and MS4 are in the southwest quadrant
- MS5, MS7, MS9, and MS10 form a cluster in the northeast quadrant
- Base station acts as central hub with radial connections
### Key Observations
1. **Connection Failures**:
- 3 out of 5 direct base station connections are broken
- Failure severity increases with distance (MS4 at 4 units broken vs MS3 at 3 units)
- MS2 (farthest node) has no direct connection shown
2. **Network Topology**:
- Nodes form a semi-circular pattern around the base station
- Northeast quadrant has denser node clustering
- Southwest quadrant shows isolated nodes (MS3, MS4)
3. **Color/Shape Consistency Issues**:
- MS4 appears as both purple circle (legend) and black triangle (diagram)
- MS2 appears as both red triangle (legend) and blue triangle (diagram)
- MS9 appears as green circle (legend) but positioned at (0,1.5)
### Interpretation
This diagram represents a network infrastructure analysis showing:
1. **Centralized Architecture**: The base station serves as the primary connection point, with all nodes dependent on this single hub
2. **Failure Points**: The "Broken by" labels suggest a failure taxonomy where higher numbers indicate more severe or frequent disruptions
3. **Geospatial Correlation**: Nodes in the southwest quadrant (MS3, MS4) show more connection failures despite being closer to the base station than some northeast nodes
4. **Redundancy Issues**: Only 2 intact direct connections exist between nodes and the base station, suggesting potential single-point failure risks
5. **Data Integrity Concerns**: Legend inconsistencies (e.g., MS4 having two different visual representations) indicate possible data labeling errors or version mismatches in the diagram
The network appears vulnerable to base station failures, with 60% of direct connections compromised. The spatial distribution of nodes and connection failures suggests potential environmental factors affecting connectivity in different quadrants. The legend inconsistencies highlight the need for data validation in network diagrams.