## Diagram: Four Frames of a Process
### Overview
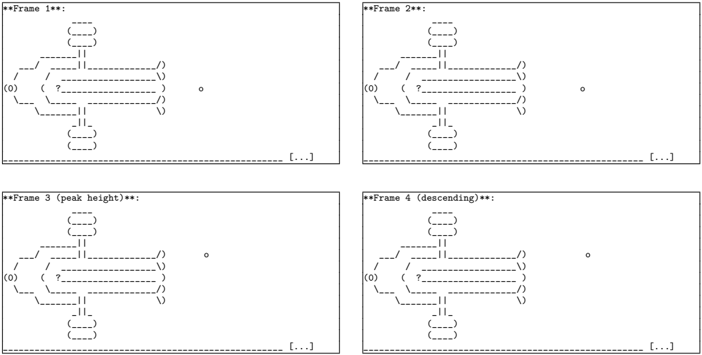
The image presents four frames, labeled "Frame 1" through "Frame 4," depicting a process or state change using ASCII art. The frames show a central structure with elements that appear to change or evolve across the sequence. The frames are arranged in a 2x2 grid.
### Components/Axes
* **Frame Titles:** Each frame is labeled with a title:
* Frame 1
* Frame 2
* Frame 3 (peak height)
* Frame 4 (descending)
* **Central Structure:** Each frame contains a central structure composed of:
* Top: Three stacked rounded rectangles.
* Middle: A central section with a question mark "?" inside dashed lines.
* Bottom: Three stacked rounded rectangles.
* **Input/Output:** Each frame has an element labeled "(o)" on the left side, connected to the central structure. On the right side, there are angled lines resembling output.
* **Indicator Dot:** A small dot is present on the right side of each frame.
* **Base Line:** A dashed line runs along the bottom of each frame, with "[...]" at the center.
### Detailed Analysis or ### Content Details
**Frame 1:**
* The central structure is in its initial state.
* The "(o)" element is present on the left.
* The indicator dot is present on the right.
**Frame 2:**
* The central structure appears unchanged from Frame 1.
* The "(o)" element is present on the left.
* The indicator dot is present on the right.
**Frame 3 (peak height):**
* The central structure appears unchanged from Frame 1 and Frame 2.
* The "(o)" element is present on the left.
* The indicator dot is present on the right.
**Frame 4 (descending):**
* The central structure appears unchanged from Frame 1, Frame 2, and Frame 3.
* The "(o)" element is present on the left.
* The indicator dot is present on the right.
### Key Observations
* The frames depict a sequence, but the central structure remains visually consistent across all four frames.
* The titles "peak height" and "descending" suggest a process that reaches a peak and then declines, but this is not visually represented in the central structure.
* The indicator dot remains constant across all frames.
### Interpretation
The diagram likely represents a process or system where the internal state (represented by the central structure) is being monitored or influenced. The labels "peak height" and "descending" suggest that the process involves a measurable quantity that increases to a peak and then decreases. However, the visual representation of the central structure does not reflect this change, implying that the diagram focuses on the input/output and monitoring aspects rather than the internal transformation. The "(o)" element could represent an input or trigger, while the angled lines on the right could represent the output or result of the process. The indicator dot might represent a status indicator or a measurement point. The "[...]" at the bottom suggests that the process continues beyond what is shown in the frames.