## Diagram: Process Flow with Frame Stages
### Overview
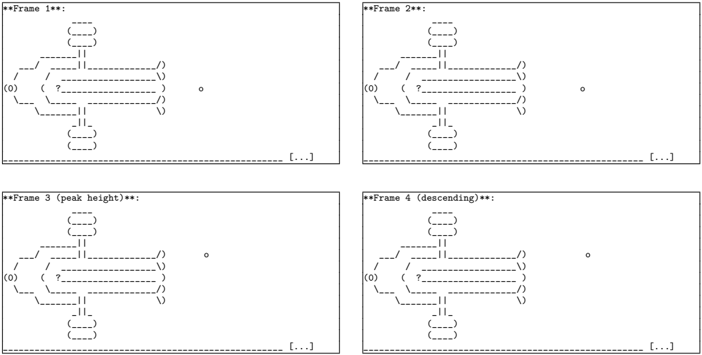
The image depicts a technical diagram divided into four labeled frames (Frame 1, Frame 2, Frame 3, Frame 4), each illustrating a process flow with a central vertical line, branching horizontal lines, and symbolic elements (circles, question marks). The frames are annotated with descriptors: "Frame 3 (peak height)" and "Frame 4 (descending)."
### Components/Axes
- **Central Vertical Line**: A dashed line running vertically through the center of each frame, likely representing a core process or axis of measurement.
- **Branching Horizontal Lines**: Multiple dashed lines extending horizontally from the vertical line, possibly indicating parallel processes or data streams.
- **Circles**: Small circles at the top and bottom of the vertical line, potentially representing input/output nodes or reference points.
- **Question Marks**: Symbols placed near the horizontal lines in Frames 1–3, suggesting variables, uncertainties, or decision points.
- **Labels**:
- Frame 1: "Frame 1**"
- Frame 2: "Frame 2**"
- Frame 3: "Frame 3 (peak height)**"
- Frame 4: "Frame 4 (descending)**"
- **Spacing**: Consistent spacing between elements across frames, with no explicit axis markers or scales.
### Detailed Analysis
- **Frame 1**: Central vertical line with two horizontal branches (left and right). A circle at the top and bottom of the vertical line. A question mark near the left branch.
- **Frame 2**: Similar structure to Frame 1, but the question mark is absent. The horizontal branches appear slightly more spaced apart.
- **Frame 3 (peak height)**: The vertical line is annotated with "(peak height)", suggesting a maximum value or threshold. The horizontal branches are more pronounced, and the question mark is present near the left branch.
- **Frame 4 (descending)**: The vertical line is labeled "(descending)", indicating a reduction or decline. The horizontal branches are less dense, and the question mark is absent.
### Key Observations
1. **Consistency**: All frames share the same structural elements (vertical line, horizontal branches, circles), implying a standardized process flow.
2. **Labeling**: Frame 3 and Frame 4 explicitly describe dynamic states ("peak height," "descending"), suggesting temporal or conditional changes.
3. **Question Marks**: Present in Frames 1–3 but absent in Frame 4, possibly indicating uncertainty or unresolved variables in earlier stages.
4. **Spacing**: No numerical values or scales are provided, making quantitative analysis impossible.
### Interpretation
The diagram likely represents a multi-stage process or system with distinct phases:
- **Frames 1–2**: Initial stages with potential uncertainties (question marks) and parallel processes (horizontal branches).
- **Frame 3**: A critical peak or maximum state, where the system reaches a defined threshold ("peak height").
- **Frame 4**: A descending phase, where the system transitions to a reduced or stabilized state, with no unresolved variables (no question marks).
The absence of numerical data or explicit legends limits quantitative interpretation. However, the labels and structural changes suggest a progression from exploration (Frames 1–2) to a defined peak (Frame 3) and eventual decline (Frame 4). The question marks may represent variables requiring further investigation or external inputs.
### Notes
- No numerical data, heatmaps, or explicit legends are present.
- The diagram emphasizes structural and label-based relationships rather than quantitative trends.
- The term "descending" in Frame 4 implies a directional change, possibly in output, efficiency, or another measurable parameter.