## Line Chart: Shannon and Bayesian Surprises
### Overview
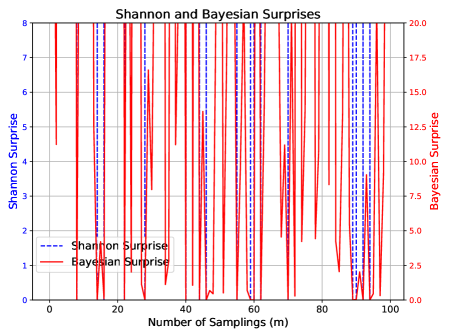
The image is a line chart comparing Shannon Surprise and Bayesian Surprise over a number of samplings. The x-axis represents the number of samplings, while the left y-axis represents Shannon Surprise and the right y-axis represents Bayesian Surprise. The chart displays two data series: Shannon Surprise (blue dashed line) and Bayesian Surprise (red solid line).
### Components/Axes
* **Title:** Shannon and Bayesian Surprises
* **X-axis:** Number of Samplings (m), ranging from 0 to 100 in increments of 20.
* **Left Y-axis:** Shannon Surprise, ranging from 0 to 8 in increments of 1.
* **Right Y-axis:** Bayesian Surprise, ranging from 0.0 to 20.0 in increments of 2.5.
* **Legend:** Located in the bottom-left corner.
* Shannon Surprise (blue dashed line)
* Bayesian Surprise (red solid line)
### Detailed Analysis
* **Shannon Surprise (blue dashed line):** The Shannon Surprise line is mostly at the maximum value of 8, with occasional drops to lower values. The drops appear to be sharp and instantaneous.
* The line starts at approximately 8.
* It drops to approximately 0 around x=10.
* It returns to 8 until x=20.
* It drops to approximately 0 around x=20.
* It returns to 8 until x=30.
* It drops to approximately 0 around x=30.
* It returns to 8 until x=40.
* It drops to approximately 0 around x=40.
* It returns to 8 until x=50.
* It drops to approximately 0 around x=50.
* It returns to 8 until x=60.
* It drops to approximately 0 around x=60.
* It returns to 8 until x=70.
* It drops to approximately 0 around x=70.
* It returns to 8 until x=80.
* It drops to approximately 0 around x=80.
* It returns to 8 until x=90.
* It drops to approximately 0 around x=90.
* It returns to 8 until x=100.
* **Bayesian Surprise (red solid line):** The Bayesian Surprise line fluctuates significantly, with many sharp drops to near 0 and rapid returns to higher values.
* The line starts at approximately 8.
* It drops to approximately 4.5 around x=5.
* It returns to 8 until x=10.
* It drops to approximately 0 around x=10.
* It returns to 8 until x=15.
* It drops to approximately 0 around x=15.
* It returns to 8 until x=20.
* It drops to approximately 0 around x=20.
* It returns to 8 until x=25.
* It drops to approximately 0 around x=25.
* It returns to 8 until x=30.
* It drops to approximately 0 around x=30.
* It returns to 8 until x=35.
* It drops to approximately 0 around x=35.
* It returns to 8 until x=40.
* It drops to approximately 0 around x=40.
* It returns to 8 until x=45.
* It drops to approximately 0 around x=45.
* It returns to 8 until x=50.
* It drops to approximately 0 around x=50.
* It returns to 8 until x=55.
* It drops to approximately 0 around x=55.
* It returns to 8 until x=60.
* It drops to approximately 0 around x=60.
* It returns to 8 until x=65.
* It drops to approximately 0 around x=65.
* It returns to 8 until x=70.
* It drops to approximately 0 around x=70.
* It returns to 8 until x=75.
* It drops to approximately 0 around x=75.
* It returns to 8 until x=80.
* It drops to approximately 0 around x=80.
* It returns to 8 until x=85.
* It drops to approximately 0 around x=85.
* It returns to 8 until x=90.
* It drops to approximately 0 around x=90.
* It returns to 8 until x=95.
* It drops to approximately 0 around x=95.
* It returns to 8 until x=100.
### Key Observations
* Both Shannon Surprise and Bayesian Surprise exhibit frequent and sharp drops, indicating moments of high surprise.
* The Shannon Surprise tends to stay at its maximum value more often than the Bayesian Surprise.
* The Bayesian Surprise fluctuates more frequently and to a greater extent than the Shannon Surprise.
### Interpretation
The chart compares two different measures of "surprise" over a series of samplings. The frequent drops in both lines suggest that surprising events are common. The difference in the frequency and magnitude of fluctuations between the two lines indicates that Bayesian Surprise is more sensitive to changes in the data than Shannon Surprise. This could be because Bayesian Surprise incorporates prior knowledge or beliefs, making it more responsive to unexpected events. The data suggests that while both measures capture surprise, they do so in different ways, potentially reflecting different underlying assumptions or sensitivities to the data.