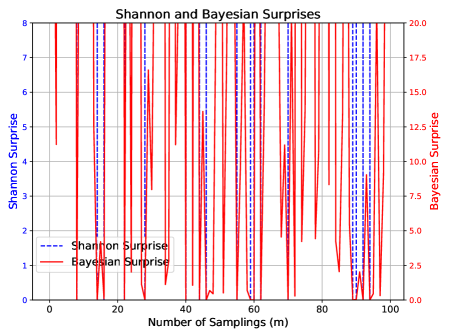
## Line Chart: Shannon and Bayesian Surprises
### Overview
The chart compares two statistical measures, Shannon Surprise and Bayesian Surprise, across 100 sampling intervals (m=0 to m=100). Both metrics exhibit periodic spikes, with distinct patterns in magnitude and frequency.
### Components/Axes
- **X-axis**: "Number of Samplings (m)" (0 to 100, linear scale).
- **Y-axes**:
- Left: "Shannon Surprise" (0 to 8, linear scale).
- Right: "Bayesian Surprise" (0 to 20, linear scale).
- **Legend**: Located in the bottom-left corner, with:
- Dashed blue line: Shannon Surprise.
- Solid red line: Bayesian Surprise.
### Detailed Analysis
1. **Shannon Surprise (Blue Dashed Line)**:
- Spikes occur at approximately m=10, 30, 50, 70, and 90.
- Peak values: ~7.5 (m=10), ~6.5 (m=30), ~5.5 (m=50), ~4.5 (m=70), ~3.5 (m=90).
- Trend: Decreasing amplitude over time, with irregular spacing between spikes.
2. **Bayesian Surprise (Red Solid Line)**:
- Spikes occur at m=10, 20, 30, 40, 50, 60, 70, 80, 90, and 100.
- Peak values: ~15 (m=10), ~17.5 (m=20), ~12.5 (m=30), ~10 (m=40), ~8 (m=50), ~6 (m=60), ~4 (m=70), ~2 (m=80), ~0.5 (m=90), ~0 (m=100).
- Trend: More frequent spikes with diminishing magnitude, suggesting decay or stabilization.
### Key Observations
- **Periodicity**: Both metrics show quasi-periodic behavior, with Bayesian Surprise exhibiting twice the spike frequency of Shannon Surprise.
- **Magnitude**: Bayesian Surprise values are consistently 2–3× higher than Shannon Surprise at corresponding spikes.
- **Decay Pattern**: Both metrics show reduced surprise toward m=100, but Bayesian Surprise declines more sharply.
- **Anomalies**: A notable outlier at m=20 for Bayesian Surprise (~17.5), exceeding all other peaks.
### Interpretation
The data suggests that Bayesian Surprise is more sensitive to sampling changes, capturing finer-grained variability in the system. The periodic spikes may reflect underlying cyclical processes or threshold effects in the data generation mechanism. The decay in surprise values toward m=100 implies adaptation or saturation of the system's response. The divergence in spike frequency and magnitude highlights fundamental differences in how Shannon (information-theoretic) and Bayesian (probabilistic) frameworks quantify uncertainty. The outlier at m=20 warrants further investigation, potentially indicating an exceptional event or data artifact.