## Line Graph: Accuracy vs. Sample Size (k)
### Overview
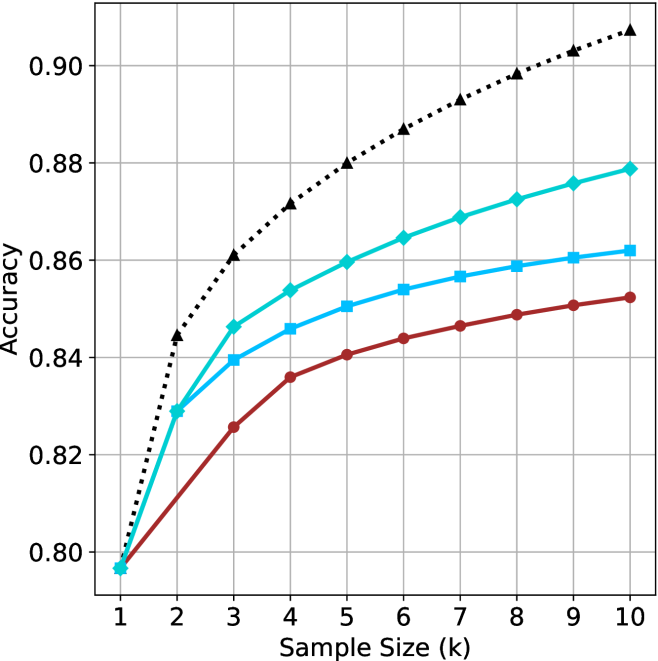
The image depicts a line graph comparing the accuracy of three methods (A, B, C) across varying sample sizes (k = 1 to 10). Accuracy is measured on the y-axis (0.80–0.90), while the x-axis represents sample size. Three distinct lines correspond to the methods, with trends indicating performance changes as sample size increases.
### Components/Axes
- **X-axis (Sample Size, k)**: Labeled "Sample Size (k)" with integer markers from 1 to 10.
- **Y-axis (Accuracy)**: Labeled "Accuracy" with increments of 0.02 from 0.80 to 0.90.
- **Legend**: Located on the right, associating:
- **Black dotted line**: Method A
- **Blue line**: Method B
- **Red line**: Method C
### Detailed Analysis
1. **Method A (Black Dotted Line)**:
- Starts at **0.80** when k=1.
- Increases steadily, reaching **0.90** at k=10.
- Shows consistent upward trend with no plateaus.
2. **Method B (Blue Line)**:
- Begins at **0.83** when k=1.
- Rises to **0.86** at k=5, then plateaus between **0.86–0.88** for k=6–10.
- Slight upward curvature before plateauing.
3. **Method C (Red Line)**:
- Starts at **0.80** when k=1.
- Increases to **0.85** at k=5, then plateaus between **0.85–0.87** for k=6–10.
- Slower growth rate compared to Method A.
### Key Observations
- **Method A** outperforms B and C across all sample sizes, with the largest gap at k=10 (0.90 vs. 0.88 for B and 0.87 for C).
- **Methods B and C** exhibit diminishing returns after k=5, with accuracy stabilizing.
- **Initial Performance**: All methods start at similar accuracy levels (0.80–0.83) for k=1–2.
### Interpretation
The data suggests **Method A** is the most effective, as its accuracy continues to improve with larger sample sizes, while B and C plateau. This could indicate that Method A scales better or has fewer computational constraints. The plateau in B and C might reflect inherent limitations (e.g., model complexity, data saturation) or optimization for smaller datasets. Method B’s slightly higher plateau than C implies marginal superiority in larger samples, but both lag behind A. The trends highlight the importance of sample size in method selection, with A being optimal for high-accuracy requirements.