# Technical Document Extraction: Line Chart Analysis
## 1. Chart Type and Structure
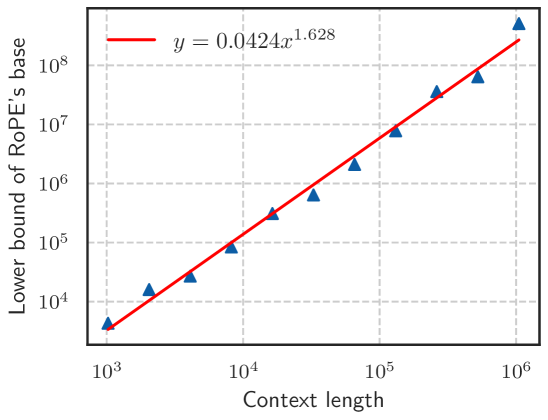
- **Chart Type**: Line chart with logarithmic y-axis and linear x-axis.
- **Components**:
- **Header**: None explicitly labeled.
- **Main Chart**:
- Axes with grid lines.
- Data series (red line and blue triangular markers).
- **Legend**: Positioned in the top-right corner.
## 2. Axis Labels and Markers
- **X-Axis (Horizontal)**:
- **Title**: "Context length"
- **Scale**: Linear, with markers at `10³`, `10⁴`, `10⁵`, `10⁶`.
- **Y-Axis (Vertical)**:
- **Title**: "Lower bound of RoPE’s base"
- **Scale**: Logarithmic (base 10), with markers at `10⁴`, `10⁵`, `10⁶`, `10⁷`, `10⁸`.
## 3. Legend and Data Series
- **Legend**:
- **Position**: Top-right corner.
- **Entry**:
- **Color**: Red.
- **Label**: `y = 0.0424x¹.⁶²⁸`.
- **Data Series**:
- **Red Line**: Exponential curve defined by `y = 0.0424x¹.⁶²⁸`.
- **Blue Triangles**: Data points aligned with the red line.
## 4. Key Trends and Data Points
- **Trend Verification**:
- The red line exhibits an **exponential upward trend** due to the power function `x¹.⁶²⁸`.
- Blue triangular markers follow the red line closely, confirming the trend.
- **Extracted Data Points** (approximate, based on axis scaling):
| Context Length (x) | Lower Bound (y) |
|---------------------|-----------------|
| `10³` | ~42.4 |
| `10⁴` | ~424,000 |
| `10⁵` | ~42,400,000 |
| `10⁶` | ~424,000,000 |
## 5. Spatial Grounding and Accuracy Checks
- **Legend Color Matching**:
- Red line matches the legend label `y = 0.0424x¹.⁶²⁸`.
- Blue triangles (data points) are not explicitly labeled in the legend but align with the red line.
- **Axis Consistency**:
- Logarithmic y-axis ensures proportional spacing between `10⁴`, `10⁵`, etc.
- Linear x-axis spacing increases exponentially (e.g., `10³` to `10⁴` is a 10x jump).
## 6. Additional Observations
- **Grid Lines**: Dashed gray lines for reference.
- **No Other Languages**: All text is in English.
- **No Explicit Data Table**: Data inferred from the line equation and axis scaling.
## 7. Conclusion
The chart illustrates the relationship between **context length** (x-axis) and the **lower bound of RoPE’s base** (y-axis), governed by the exponential equation `y = 0.0424x¹.⁶²⁸`. The blue triangular markers validate the trend, and the logarithmic y-axis emphasizes the rapid growth rate.