## Line Chart: Average Accuracy vs. Rank
### Overview
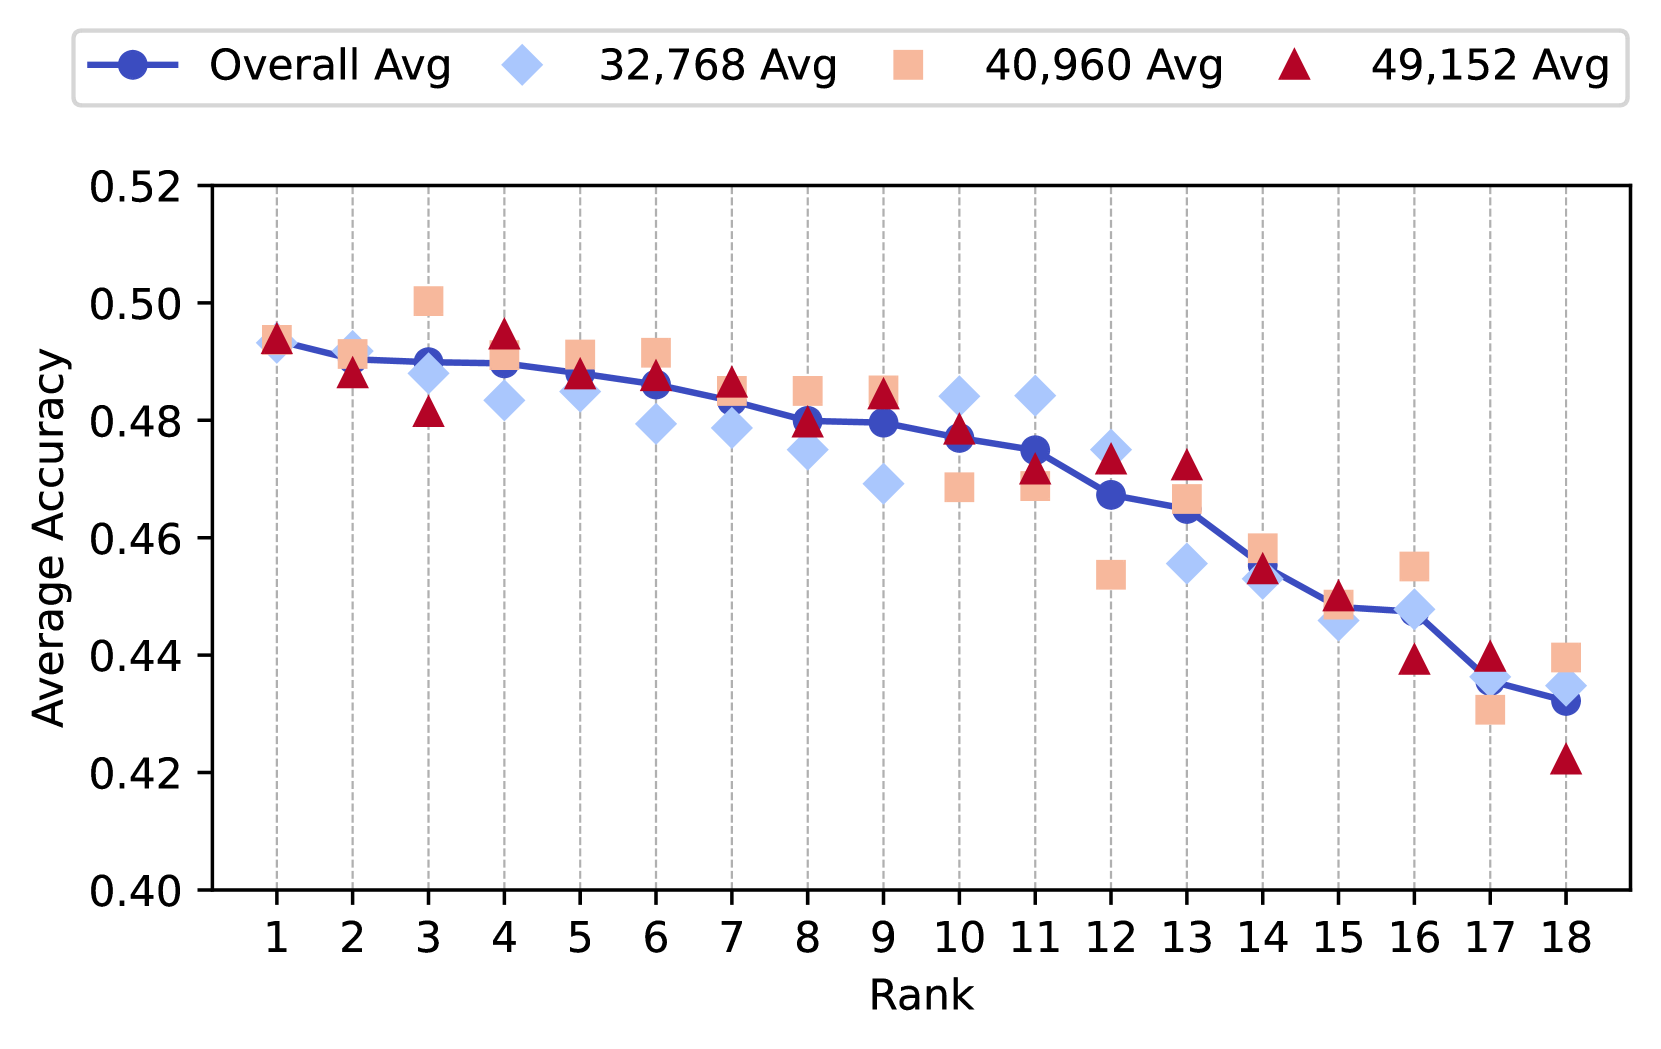
The image is a line chart that plots the average accuracy against rank for an overall average and three other averages: 32,768 Avg, 40,960 Avg, and 49,152 Avg. The chart shows a general downward trend in average accuracy as rank increases.
### Components/Axes
* **X-axis:** Rank, labeled from 1 to 18.
* **Y-axis:** Average Accuracy, ranging from 0.40 to 0.52 with increments of 0.02.
* **Legend (Top-Left):**
* Blue circle: Overall Avg
* Light blue diamond: 32,768 Avg
* Light orange square: 40,960 Avg
* Red triangle: 49,152 Avg
### Detailed Analysis
**Overall Avg (Blue Line):** The overall average accuracy generally decreases as rank increases.
* Rank 1: Approximately 0.493
* Rank 5: Approximately 0.486
* Rank 10: Approximately 0.480
* Rank 15: Approximately 0.448
* Rank 18: Approximately 0.432
**32,768 Avg (Light Blue Diamonds):** The average accuracy for 32,768 also decreases with increasing rank.
* Rank 2: Approximately 0.487
* Rank 7: Approximately 0.480
* Rank 12: Approximately 0.470
* Rank 17: Approximately 0.435
**40,960 Avg (Light Orange Squares):** The average accuracy for 40,960 decreases with increasing rank.
* Rank 3: Approximately 0.500
* Rank 8: Approximately 0.485
* Rank 13: Approximately 0.460
* Rank 16: Approximately 0.455
**49,152 Avg (Red Triangles):** The average accuracy for 49,152 decreases with increasing rank.
* Rank 1: Approximately 0.495
* Rank 6: Approximately 0.490
* Rank 11: Approximately 0.475
* Rank 18: Approximately 0.422
### Key Observations
* All four data series (Overall Avg, 32,768 Avg, 40,960 Avg, and 49,152 Avg) exhibit a decreasing trend in average accuracy as rank increases.
* The Overall Avg line is generally positioned between the 32,768 Avg and 40,960 Avg lines.
* The 49,152 Avg data series generally has the highest accuracy at lower ranks, but drops to the lowest accuracy at higher ranks.
### Interpretation
The chart suggests that as rank increases, the average accuracy tends to decrease across all the data series. This could indicate that the performance of the system or model being evaluated degrades at higher ranks. The different averages (32,768, 40,960, and 49,152) might represent different configurations or parameter settings, and their varying performance at different ranks could provide insights into their relative strengths and weaknesses. The 49,152 Avg starts with the highest accuracy but ends with the lowest, suggesting it might be overfitting or less robust at higher ranks compared to the other configurations.