## Bar Chart: Unlabeled Data Series (1988–2022)
### Overview
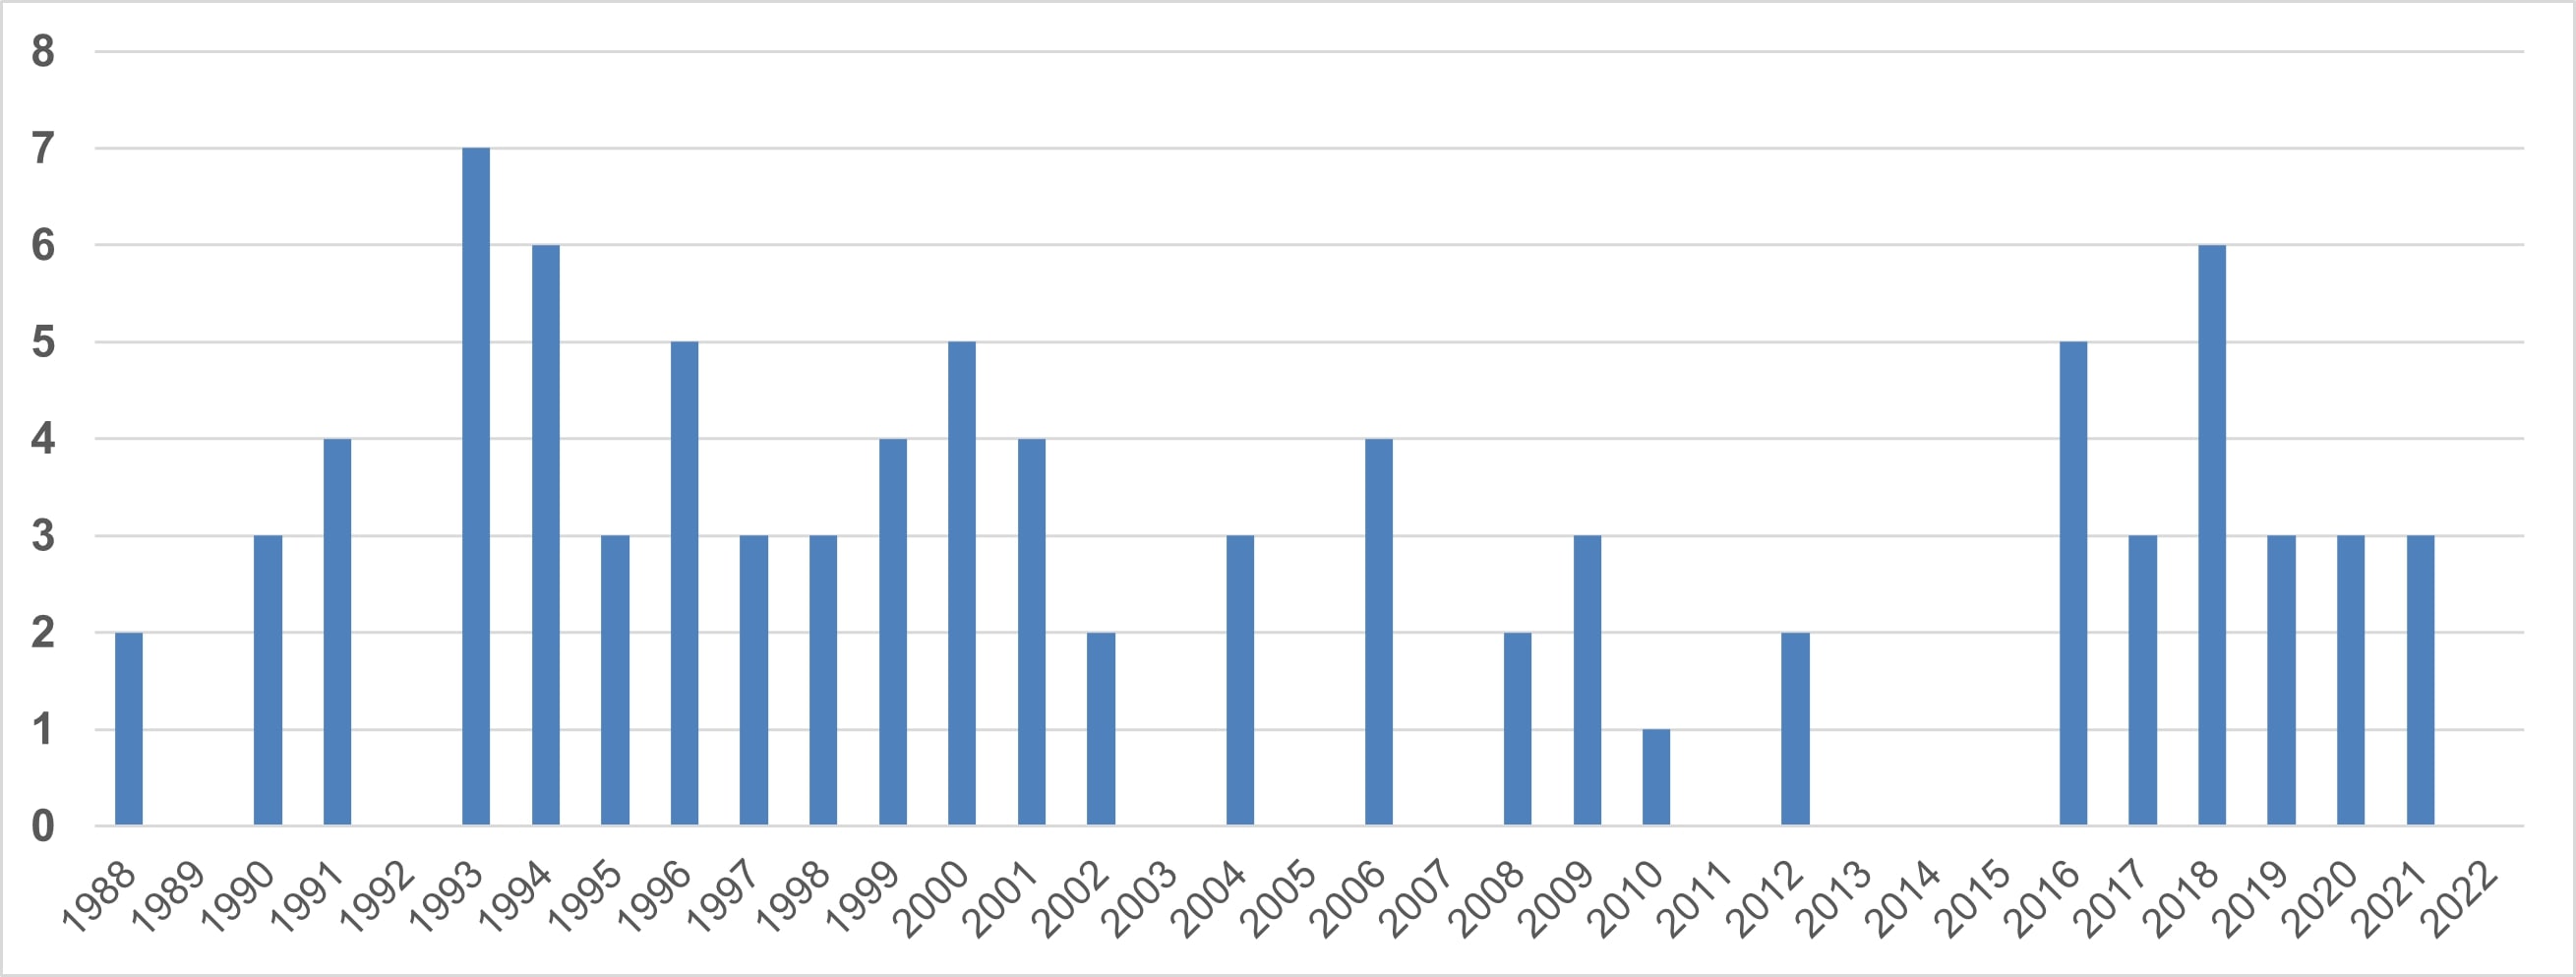
The chart displays a time-series bar graph with years (1988–2022) on the x-axis and an unlabeled y-axis (scale 0–8). Bars represent a metric (unspecified) for specific years, with many years showing no data (empty bars).
### Components/Axes
- **X-axis**: Years from 1988 to 2022, labeled sequentially.
- **Y-axis**: Unlabeled numerical scale from 0 to 8 (no units or title).
- **Bars**: Blue vertical bars for data points; no legend or color key.
- **Missing Data**: Empty bars for years 1989, 1992, 1995, 1997, 1998, 2003, 2005, 2007, 2011, 2013, 2014, 2015, 2022.
### Detailed Analysis
- **1988**: Bar height ~2.
- **1990**: Bar height ~3.
- **1991**: Bar height ~4.
- **1993**: Peak at ~7.
- **1994**: Bar height ~6.
- **1996**: Bar height ~5.
- **1999**: Bar height ~4.
- **2000**: Bar height ~4.
- **2001**: Bar height ~4.
- **2004**: Bar height ~3.
- **2006**: Bar height ~4.
- **2009**: Bar height ~2.
- **2010**: Bar height ~1.
- **2012**: Bar height ~2.
- **2016**: Bar height ~5.
- **2017**: Bar height ~3.
- **2018**: Peak at ~6.
- **2019–2021**: Bars at ~3.
- **2022**: No data (empty bar).
### Key Observations
1. **Highest Peaks**: 1993 (~7) and 2018 (~6) show the largest values.
2. **Lowest Values**: 2010 (~1) and 2011 (no data) indicate significant drops or missing records.
3. **Fluctuations**: Data oscillates between ~1 and ~7, with no clear linear trend.
4. **Missing Data**: Over 10 years (1989, 1992, etc.) lack recorded values, suggesting gaps in data collection.
### Interpretation
The chart highlights cyclical patterns with peaks in 1993 and 2018, possibly reflecting economic, policy, or external event-driven changes. The absence of data in multiple years (e.g., 1995, 2003) raises questions about data reliability or collection methods. The 2010–2011 dip and subsequent recovery in 2016–2018 suggest a potential correlation with global events (e.g., financial crises, technological shifts). However, without contextual labels (y-axis metric, title), causal relationships remain speculative. The recurring ~3–4 range in later years (2019–2021) may indicate stabilization or normalization post-2018 peak.