\n
## Bar Chart: Performance Comparison of Different Configurations
### Overview
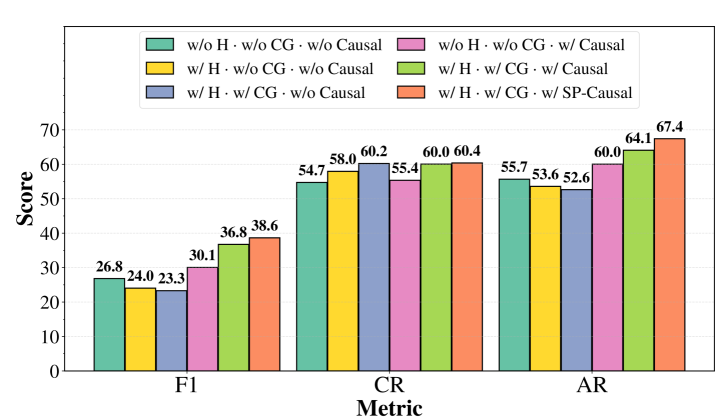
This bar chart compares the performance of different configurations (denoted by color) across three metrics: F1, CR, and AR. The configurations vary based on the inclusion of "H" (likely a feature or component), "CG" (likely another feature or component), and "Causal" reasoning. The y-axis represents a "Score", and the x-axis represents the three metrics.
### Components/Axes
* **X-axis:** "Metric" with three categories: "F1", "CR", and "AR".
* **Y-axis:** "Score" ranging from 0 to 70, with increments of 10.
* **Legend (Top-Center):**
* Light Green: "w/o H · w/o CG · w/o Causal"
* Yellow: "w/ H · w/o CG · w/o Causal"
* Blue: "w/ H · w/ CG · w/o Causal"
* Pink: "w/ H · w/ CG · w/ SP-Causal"
### Detailed Analysis
The chart consists of three groups of bars, one for each metric (F1, CR, AR). Within each group, there are four bars, each representing a different configuration.
**F1 Metric:**
* Light Green: Approximately 26.8
* Yellow: Approximately 24.0
* Blue: Approximately 23.3
* Pink: Approximately 30.1
Trend: The pink bar (w/ H · w/ CG · w/ SP-Causal) is the highest, followed by the light green bar. The yellow and blue bars are relatively close in value.
**CR Metric:**
* Light Green: Approximately 54.7
* Yellow: Approximately 58.0
* Blue: Approximately 60.2
* Pink: Approximately 55.4
Trend: The blue bar (w/ H · w/ CG · w/o Causal) is the highest, followed by the yellow bar. The pink bar is slightly lower than the light green bar.
**AR Metric:**
* Light Green: Approximately 55.7
* Yellow: Approximately 53.6
* Blue: Approximately 52.6
* Pink: Approximately 67.4
Trend: The pink bar (w/ H · w/ CG · w/ SP-Causal) is significantly higher than the other bars. The light green bar is the second highest, followed by the yellow and blue bars.
### Key Observations
* The "w/ H · w/ CG · w/ SP-Causal" configuration (pink) consistently performs well, particularly on the AR metric, where it significantly outperforms the other configurations.
* The "w/o H · w/o CG · w/o Causal" configuration (light green) performs reasonably well on F1 and CR, but is lower on AR.
* Adding "H" and "CG" generally improves performance, especially when combined with "SP-Causal".
* The "w/ H · w/ CG · w/o Causal" (blue) configuration performs best on CR.
### Interpretation
The data suggests that incorporating both "H" and "CG" features, along with "SP-Causal" reasoning, leads to the best overall performance, especially in the AR metric. This indicates that the "SP-Causal" component is particularly beneficial when used in conjunction with the other features. The differences in performance across the metrics suggest that the configurations have varying strengths and weaknesses. For example, the "w/ H · w/ CG · w/o Causal" configuration excels at CR, while the "w/ H · w/ CG · w/ SP-Causal" configuration dominates in AR. The chart provides a clear comparison of the effectiveness of different configurations, allowing for informed decisions about which features to include in a system or model. The consistent improvement with the addition of "H", "CG", and "SP-Causal" suggests a synergistic effect between these components.