## Bar Chart: Model Performance Comparison Across Metrics
### Overview
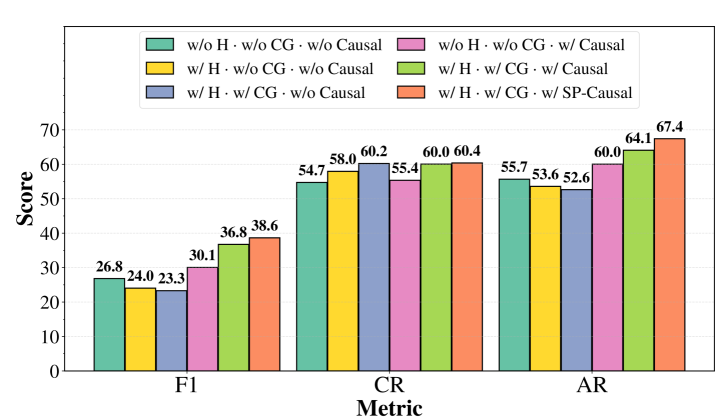
The chart compares the performance scores of six different model configurations across three evaluation metrics: F1, CR (Causal Reasoning), and AR (Answer Relevance). Each configuration varies in the inclusion of three components: **H** (likely a feature/technique), **CG** (another feature/technique), and **Causal/SP-Causal** (reasoning mechanisms). The configurations are color-coded in the legend for clarity.
### Components/Axes
- **X-axis (Metrics)**: Labeled "Metric" with categories: **F1**, **CR**, **AR**.
- **Y-axis (Score)**: Labeled "Score" with a range from 0 to 70.
- **Legend**: Positioned in the top-right corner, with six configurations:
1. **w/o H · w/o CG · w/o Causal** (teal)
2. **w/ H · w/o CG · w/o Causal** (yellow)
3. **w/ H · w/ CG · w/o Causal** (blue)
4. **w/o H · w/o CG · w/ Causal** (pink)
5. **w/ H · w/ CG · w/ Causal** (green)
6. **w/ H · w/ CG · w/ SP-Causal** (orange)
### Detailed Analysis
#### F1 Metric
- **w/o H · w/o CG · w/o Causal** (teal): 26.8
- **w/ H · w/o CG · w/o Causal** (yellow): 24.0
- **w/ H · w/ CG · w/o Causal** (blue): 23.3
- **w/o H · w/o CG · w/ Causal** (pink): 30.1
- **w/ H · w/ CG · w/ Causal** (green): 36.8
- **w/ H · w/ CG · w/ SP-Causal** (orange): 38.6
#### CR Metric
- **w/o H · w/o CG · w/o Causal** (teal): 54.7
- **w/ H · w/o CG · w/o Causal** (yellow): 58.0
- **w/ H · w/ CG · w/o Causal** (blue): 60.2
- **w/o H · w/o CG · w/ Causal** (pink): 55.4
- **w/ H · w/ CG · w/ Causal** (green): 60.0
- **w/ H · w/ CG · w/ SP-Causal** (orange): 60.4
#### AR Metric
- **w/o H · w/o CG · w/o Causal** (teal): 55.7
- **w/ H · w/o CG · w/o Causal** (yellow): 53.6
- **w/ H · w/ CG · w/o Causal** (blue): 52.6
- **w/o H · w/o CG · w/ Causal** (pink): 60.0
- **w/ H · w/ CG · w/ Causal** (green): 64.1
- **w/ H · w/ CG · w/ SP-Causal** (orange): 67.4
### Key Observations
1. **F1 Metric**:
- The **SP-Causal** configuration (orange) achieves the highest score (38.6), outperforming all others.
- Including **H** and **CG** improves performance, but **Causal** alone (pink) underperforms compared to combinations with **H** and **CG**.
2. **CR Metric**:
- The **SP-Causal** configuration (orange) again leads with 60.4, followed closely by **Causal** (green, 60.0).
- **H** and **CG** inclusion consistently boosts scores, even without **Causal**.
3. **AR Metric**:
- **SP-Causal** (orange) dominates with 67.4, significantly higher than **Causal** (green, 64.1).
- **H** and **CG** inclusion improves performance, but **Causal** alone (pink) underperforms compared to combinations.
### Interpretation
- **H** and **CG** are critical for performance across all metrics, with **H** showing a stronger impact in F1 and CR.
- **Causal** and **SP-Causal** enhance performance, but **SP-Causal** (orange) consistently outperforms **Causal** (pink), especially in AR.
- The **w/ H · w/ CG · w/ SP-Causal** configuration (orange) is the most effective overall, suggesting that combining **H**, **CG**, and **SP-Causal** yields optimal results.
- **w/o H · w/o CG · w/o Causal** (teal) is the baseline, performing poorly across all metrics.
### Spatial Grounding & Trend Verification
- **Legend**: Top-right, aligned with bar colors.
- **Trends**:
- F1: Scores increase from teal (26.8) to orange (38.6).
- CR: Scores rise from teal (54.7) to orange (60.4).
- AR: Scores peak at orange (67.4), with a notable drop in blue (52.6) compared to other configurations.
- **Color Consistency**: All bars match their legend labels (e.g., orange = SP-Causal).
### Conclusion
The data demonstrates that **H** and **CG** are foundational for performance, while **SP-Causal** provides the greatest incremental improvement, particularly in AR. This suggests that advanced reasoning mechanisms (SP-Causal) paired with robust features (H, CG) are key to achieving high scores in complex tasks.