## Heatmap: Correlation of Sample Numbers
### Overview
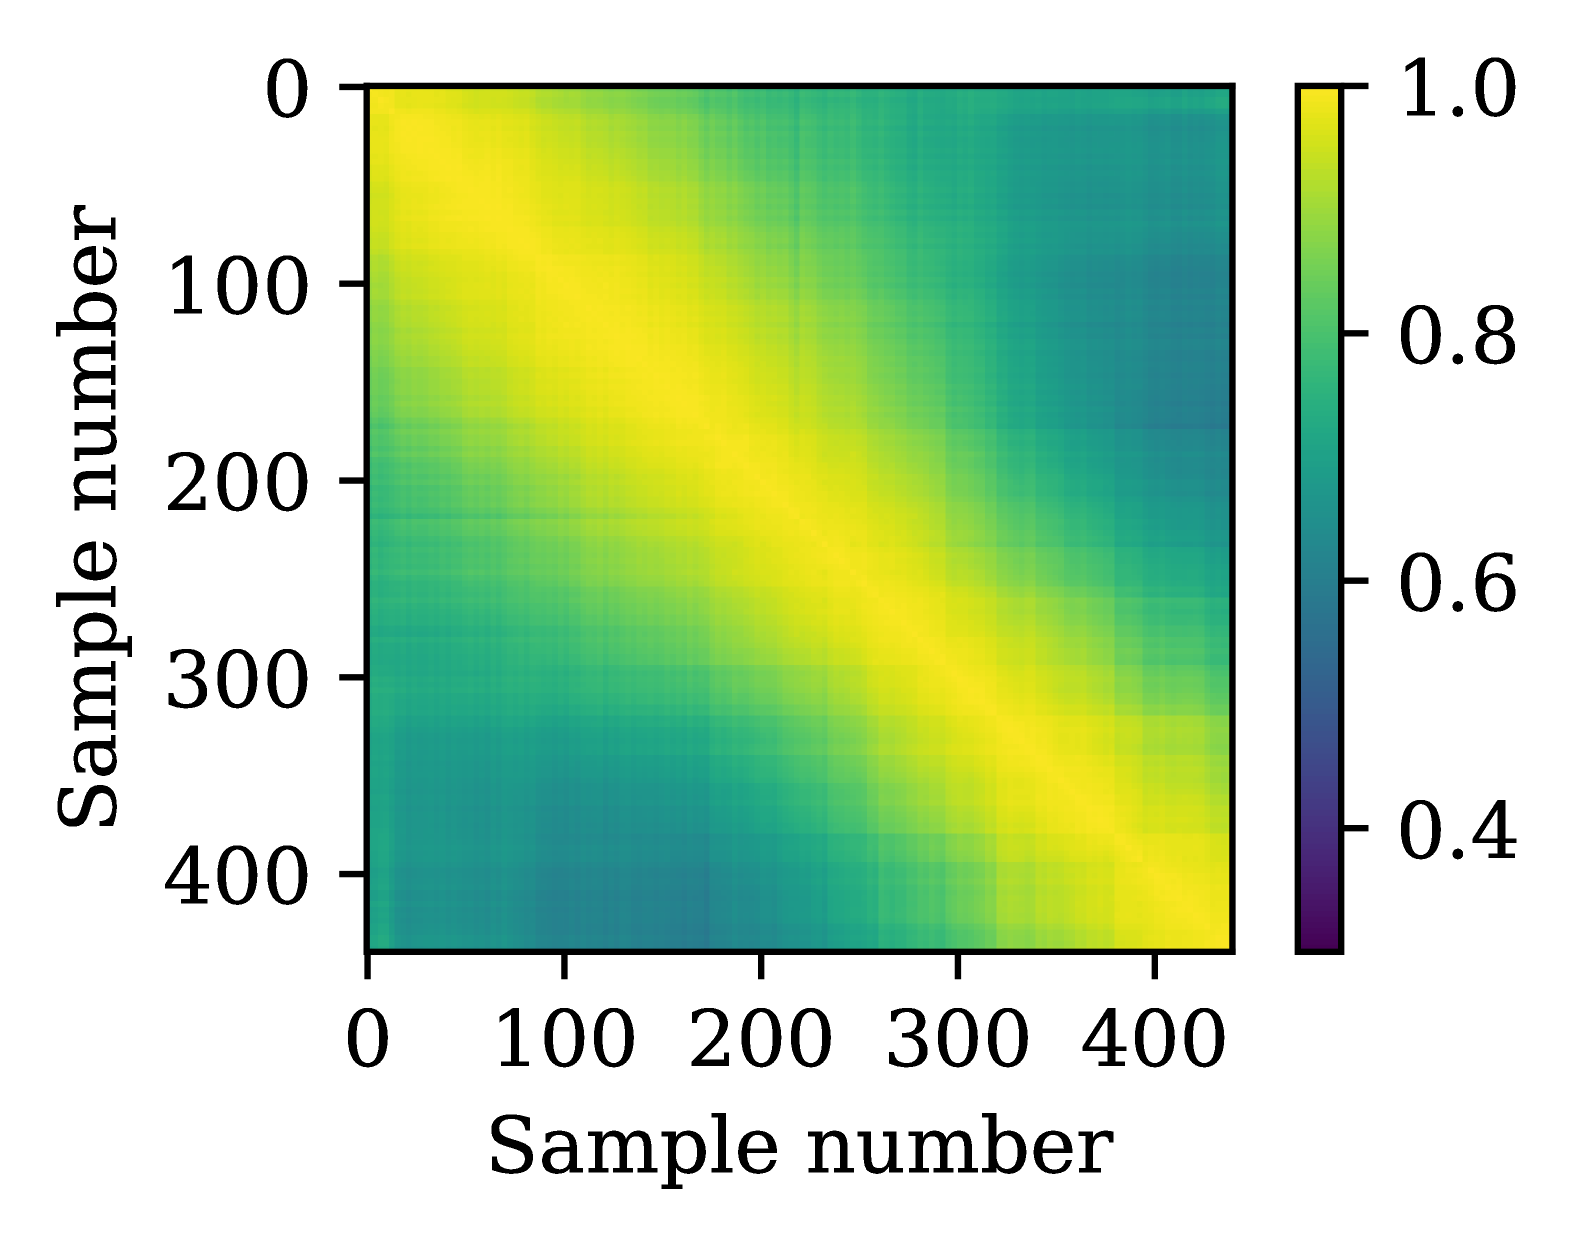
The image depicts a square heatmap visualizing the relationship between two variables labeled "Sample number" on both axes. The color gradient transitions from yellow (high values) to blue (low values), with a color bar on the right indicating numerical values from 0.4 to 1.0. The diagonal from the top-left to bottom-right corner is dominated by yellow, suggesting maximum values along this line.
### Components/Axes
- **X-axis (Sample number)**: Ranges from 0 to 400 in increments of 100.
- **Y-axis (Sample number)**: Ranges from 0 to 400 in increments of 100.
- **Color bar**: Vertical legend on the right, labeled from 1.0 (yellow) to 0.4 (blue), with intermediate values at 0.6 and 0.8.
- **Grid lines**: Faint grid overlays the heatmap, spaced evenly every 100 units on both axes.
### Detailed Analysis
- **Color gradient**:
- Yellow (1.0) dominates the diagonal, indicating maximum values when both sample numbers are equal.
- Green (0.6–0.8) appears in regions where sample numbers differ by ~100–200 units.
- Blue (0.4–0.6) occupies areas where sample numbers differ by >200 units.
- **Symmetry**: The heatmap is symmetric along the diagonal, suggesting the relationship is bidirectional (e.g., correlation between pairs of samples).
- **Resolution**: The grid lines imply discrete sampling at intervals of 100 units, though the heatmap itself appears continuous.
### Key Observations
1. **Diagonal dominance**: Values peak at 1.0 along the diagonal, indicating perfect agreement or identity when comparing a sample to itself.
2. **Rapid decay**: Values drop sharply from the diagonal, reaching ~0.6 within ~100 units and ~0.4 beyond ~200 units.
3. **Symmetry**: The heatmap’s symmetry implies the relationship is invariant to the order of samples (e.g., correlation between sample A and B is the same as B and A).
### Interpretation
This heatmap likely represents a **similarity or correlation matrix** where each cell (i,j) quantifies the relationship between sample i and sample j. The diagonal peak suggests self-comparison yields maximum similarity, while off-diagonal values reflect diminishing similarity with increasing sample number differences. The symmetry and rapid decay imply a strong dependence on proximity in sample numbering, possibly indicating clustering or grouping behavior. The use of a continuous color scale allows for nuanced interpretation of intermediate values, which could be critical for identifying subtle patterns in the data.