## Horizontal Bar Chart: CWQ Latency Comparison (with PathHD pruning)
### Overview
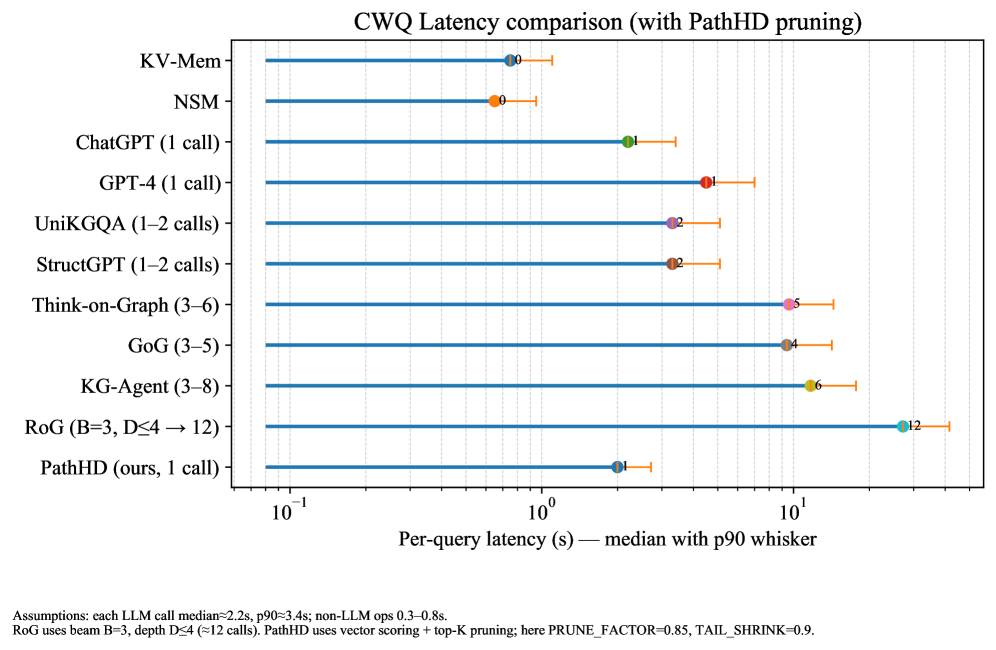
The image is a horizontal bar chart comparing the per-query latency of different methods on the CWQ dataset. The x-axis represents the per-query latency in seconds (log scale), and the y-axis lists the different methods being compared. The chart displays the median latency with a p90 whisker, indicating the 90th percentile latency.
### Components/Axes
* **Title:** CWQ Latency comparison (with PathHD pruning)
* **X-axis:**
* Label: Per-query latency (s) - median with p90 whisker
* Scale: Logarithmic (base 10)
* Ticks: 10<sup>-1</sup>, 10<sup>0</sup>, 10<sup>1</sup>
* **Y-axis:**
* Labels (from top to bottom): KV-Mem, NSM, ChatGPT (1 call), GPT-4 (1 call), UniKGQA (1-2 calls), StructGPT (1-2 calls), Think-on-Graph (3-6), GoG (3-5), KG-Agent (3-8), RoG (B=3, D≤4 → 12), PathHD (ours, 1 call)
* **Data Representation:** Each method is represented by a horizontal bar. The start of the bar indicates the median latency, and the whisker extends to the 90th percentile latency. A colored dot marks the median latency.
### Detailed Analysis
Here's a breakdown of the latency for each method, including the median and approximate p90 whisker endpoint. Note that the x-axis is logarithmic.
* **KV-Mem:**
* Median: Approximately 0.6 seconds (orange dot)
* P90 whisker endpoint: Approximately 1.2 seconds
* **NSM:**
* Median: Approximately 0.4 seconds (orange dot)
* P90 whisker endpoint: Approximately 0.8 seconds
* **ChatGPT (1 call):**
* Median: Approximately 1.2 seconds (green dot)
* P90 whisker endpoint: Approximately 2.5 seconds
* **GPT-4 (1 call):**
* Median: Approximately 2.5 seconds (red dot)
* P90 whisker endpoint: Approximately 4 seconds
* **UniKGQA (1-2 calls):**
* Median: Approximately 1.7 seconds (purple dot)
* P90 whisker endpoint: Approximately 3 seconds
* **StructGPT (1-2 calls):**
* Median: Approximately 1.7 seconds (purple dot)
* P90 whisker endpoint: Approximately 3 seconds
* **Think-on-Graph (3-6):**
* Median: Approximately 3.5 seconds (pink dot)
* P90 whisker endpoint: Approximately 6 seconds
* **GoG (3-5):**
* Median: Approximately 2.7 seconds (brown dot)
* P90 whisker endpoint: Approximately 5 seconds
* **KG-Agent (3-8):**
* Median: Approximately 4.5 seconds (yellow dot)
* P90 whisker endpoint: Approximately 7 seconds
* **RoG (B=3, D≤4 → 12):**
* Median: Approximately 12 seconds (teal dot)
* P90 whisker endpoint: Approximately 20 seconds
* **PathHD (ours, 1 call):**
* Median: Approximately 0.8 seconds (blue dot)
* P90 whisker endpoint: Approximately 1.5 seconds
### Key Observations
* The latency varies significantly across different methods.
* KV-Mem, NSM, and PathHD exhibit the lowest median latencies.
* RoG has the highest median latency.
* The p90 whisker indicates the variability in latency for each method.
### Interpretation
The chart compares the performance of different methods in terms of per-query latency on the CWQ dataset. The results suggest that methods like KV-Mem, NSM, and PathHD are more efficient in terms of latency compared to other methods like RoG. The p90 whisker provides insights into the consistency of the latency, with longer whiskers indicating greater variability. The "PathHD pruning" mentioned in the title suggests that the PathHD method utilizes a pruning technique to optimize its performance.
The assumptions at the bottom provide context for interpreting the results:
* Each LLM call median ≈2.2s, p90 ≈3.4s; non-LLM ops 0.3-0.8s.
* RoG uses beam B=3, depth D≤4 (≈12 calls). PathHD uses vector scoring + top-K pruning; here PRUNE\_FACTOR=0.85, TAIL\_SHRINK=0.9.