## Diagram: Input-Output Transformation
### Overview
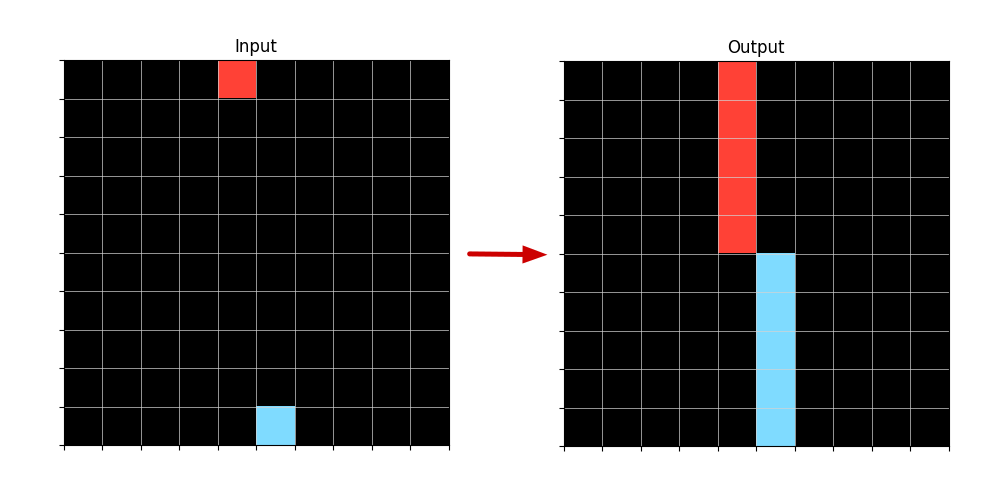
The image depicts a transformation from an "Input" grid to an "Output" grid, represented by a red arrow pointing from the left grid to the right grid. Each grid is 8x8, with a black background and white grid lines. The transformation involves the movement and alteration of colored blocks (red and light blue) between the input and output grids.
### Components/Axes
* **Grids:** Two 8x8 grids, labeled "Input" (left) and "Output" (right).
* **Colored Blocks:** Red and light blue blocks within the grids.
* **Arrow:** A red arrow pointing from the "Input" grid to the "Output" grid, indicating the transformation process.
### Detailed Analysis
**Input Grid:**
* A single red block is located at the top-left of the grid, specifically at row 1, column 1.
* A single light blue block is located at the bottom-right of the grid, specifically at row 8, column 6.
**Output Grid:**
* A vertical stack of three red blocks is located at the top-left of the grid, specifically spanning rows 1-3, column 1.
* A vertical stack of three light blue blocks is located below the red blocks, spanning rows 4-6, column 1.
**Transformation:**
* The red block from the input grid is transformed into a stack of three red blocks in the output grid.
* The light blue block from the input grid is transformed into a stack of three light blue blocks in the output grid.
* The horizontal position of the blocks changes from column 1 and 6 in the input to column 1 in the output.
* The vertical position of the blocks changes from row 1 and 8 in the input to row 1-3 and 4-6 in the output.
### Key Observations
* The transformation involves both a change in the size (number of blocks) and position of the colored blocks.
* The red and light blue blocks are stacked vertically in the output grid.
* The horizontal position of both blocks is the same in the output grid.
### Interpretation
The diagram illustrates a simple transformation process where single blocks in the input grid are converted into vertical stacks of blocks in the output grid. This could represent a basic data processing step, such as feature extraction or signal amplification. The change in position suggests a re-organization or re-alignment of the data. The diagram does not provide specific details about the nature of the data or the transformation process, but it visually represents a clear input-output relationship.